

Reference article, updated 22 October 2026. Australia exported 3.05 million tonnes of scrap metal worth A$4.58 billion in 2025-26, according to the Department of Climate Change, Energy, the Environment and Water (DCCEEW) [1]. That is the highest tonnage and the highest value in the nine years of records the department has collated, and the average price per tonne has risen by two-thirds since 2017-18. Yet most of the money is in a small share of the tonnes: non-ferrous metals, mainly copper and aluminium, were 16 percent of the weight and 67 percent of the value.
This article is a single place to find the numbers. It sets out what Australia exports, in which metals, to which countries and from which states, what the policy framework does and does not cover, what the main industry bodies are asking for, how other countries have approached the same question, and what the data cannot tell us. Every figure is traced to a named source in the reference list at the end, and where a number is an estimate by an interested party, we say so.
Key findings at a glance
| Measure, 2025-26 | Figure | Source |
|---|---|---|
| Metal scrap exported | 3.05 million tonnes, A$4.58 billion | DCCEEW [1] |
| Ferrous (iron and steel) scrap | 2.55 million tonnes, A$1.53 billion, about A$600 a tonne | DCCEEW [1] |
| Aluminium scrap | 378,000 tonnes, A$1.43 billion, about A$3,790 a tonne | DCCEEW [1] |
| Copper and copper-alloy scrap (including brass) | 113,000 tonnes, A$1.23 billion, about A$10,800 a tonne | DCCEEW [1] |
| Non-ferrous share | 16.4% of weight, 66.6% of value (A$3.05 billion) | DCCEEW [1] |
| Change since 2017-18 | Weight +24%, value +108%, average value per tonne +67% | DCCEEW [1] |
| Largest ferrous destination | Bangladesh, 31.6% of tonnes | DCCEEW [1] |
| Largest non-ferrous destination by value | China, 32.5% | DCCEEW [1] |
| Share of recovered metals exported for recycling (2024-25) | 56% | National Waste Report 2026 [2] |
| Export bans that cover metals | None. Bans cover glass, plastics, tyres and paper | Senate report [3] |
How to read these numbers
The export figures come from the Australian Bureau of Statistics, which compiles them from customs entries lodged by exporters or their agents, and DCCEEW collates them by financial year (July to June) [1]. The department itself cautions that exporters may use the wrong codes or values, that the data should be used with caution, and that figures can be revised for up to six months after publication. The 2025-26 year ended in June 2026 and the collation is dated September 2026, so the latest year is provisional.
Three further points affect how the numbers should be read:
- Values are declared export values at the border, not prices paid to collectors and not what the material later fetches overseas.
- "Scrap" spans very different products. A tonne of shredded steel and a tonne of copper alloy turnings are both "metal scrap" in the customs codes, but one is worth about A$600 and the other about A$12,000.
- The data does not say how processed the material is. It cannot tell us how much of the ferrous tonnage is clean, graded scrap and how much is unprocessed material from end-of-life vehicles and appliances. Where that split matters, we cite the Australian Steel Institute's own estimate and label it.
The nine-year view: more tonnes, far more value
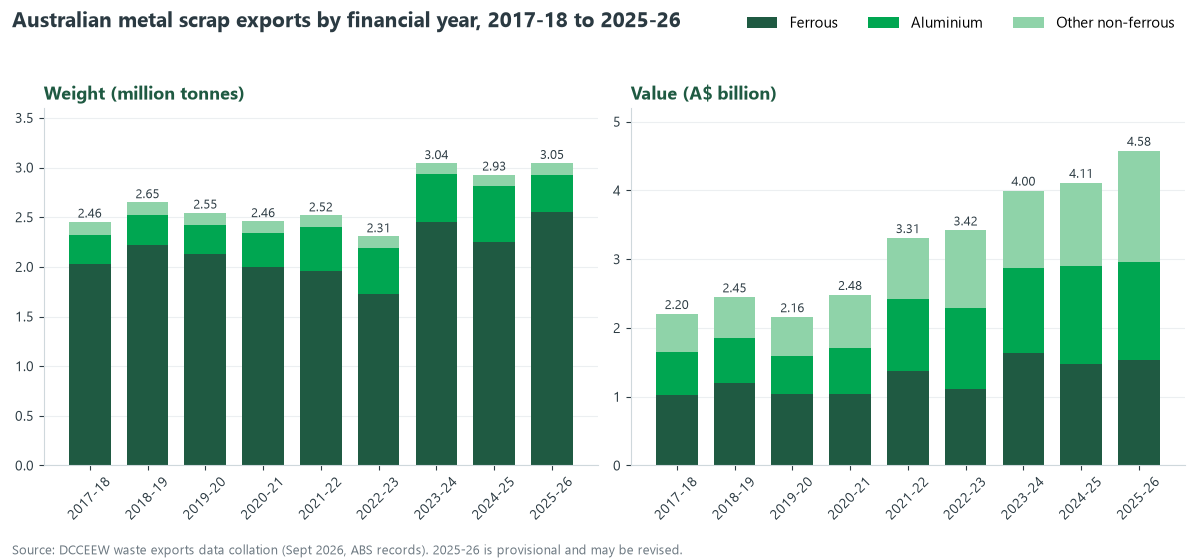
Metal scrap exports rose from 2.46 million tonnes in 2017-18 to 3.05 million tonnes in 2025-26, an increase of 24 percent. Their declared value more than doubled, from A$2.20 billion to A$4.58 billion, because the average value per tonne climbed from about A$898 to about A$1,503 [1]. Most of that rise came in 2021-22 and 2022-23, when the average jumped from about A$1,009 to about A$1,482.
| Financial year | Weight (million tonnes) | Value (A$ billion) | Average value (A$ per tonne) | Ferrous (million tonnes) |
|---|---|---|---|---|
| 2017-18 | 2.46 | 2.20 | 898 | 2.03 |
| 2018-19 | 2.65 | 2.45 | 923 | 2.22 |
| 2019-20 | 2.55 | 2.16 | 848 | 2.13 |
| 2020-21 | 2.46 | 2.48 | 1,009 | 2.00 |
| 2021-22 | 2.52 | 3.31 | 1,314 | 1.96 |
| 2022-23 | 2.31 | 3.42 | 1,482 | 1.73 |
| 2023-24 | 3.04 | 4.00 | 1,314 | 2.46 |
| 2024-25 | 2.93 | 4.11 | 1,404 | 2.25 |
| 2025-26 | 3.05 | 4.58 | 1,503 | 2.55 |
From 2025-26 over the previous year, weight rose 4.0 percent and value rose 11.3 percent. Ferrous exports of 2.55 million tonnes were the most in any year since at least 2017-18 [1]. Metals are also the core of Australia's waste export trade: of the 4.99 million tonnes and A$7.00 billion of waste and recovered materials recorded for export in 2025-26, metals were 61 percent of the tonnes and 65 percent of the value (ScrapTrade calculation from [1]).
Weight is not value: why non-ferrous matters
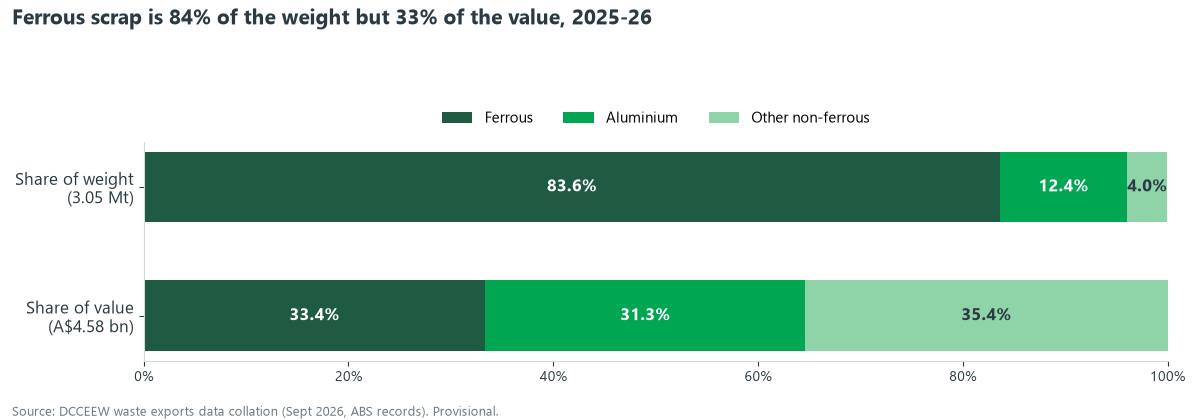
The single most useful fact in the data is how differently the two groups behave. Ferrous scrap is 84 percent of the weight but 33 percent of the value. Aluminium is 12 percent of the weight and 31 percent of the value. All other non-ferrous metals together are 4 percent of the weight and 35 percent of the value [1].
| Product group, 2025-26 | Tonnes | Value (A$ million) | Average (A$ per tonne) | Times the ferrous price |
|---|---|---|---|---|
| Ferrous (all iron and steel codes) | 2,547,805 | 1,530 | 600 | 1.0 |
| Aluminium (all codes, including cans) | 377,501 | 1,431 | 3,790 | 6.3 |
| Copper and copper alloys (including brass) | 113,411 | 1,226 | 10,806 | 18.0 |
| Precious-metal and platinum-group scrap | 2,238 | 371 | 165,659 | 276 |
Inside the non-ferrous total of A$3.05 billion, the largest items were aluminium scrap excluding cans (A$1.12 billion from 275,000 tonnes), copper alloys (A$944 million from 77,000 tonnes), aluminium beverage cans (A$313 million from 102,000 tonnes), precious-metal scrap (A$269 million from about 1,800 tonnes), brass (A$162 million from 13,000 tonnes) and platinum-group scrap (A$102 million from about 450 tonnes) [1]. A tonne of copper scrap is worth about 18 times a tonne of ferrous scrap, which is why a policy that moves the ferrous tonnage affects far less value than one that moves the copper and aluminium.
One caution on aluminium. Its recorded export weight fell from 0.57 million tonnes in 2024-25 to 0.38 million in 2025-26 while its value held at about A$1.4 billion, so the apparent value per tonne rose by about half in a year [1]. That swing may reflect prices, product mix or later revisions to a provisional year, and it should not be read as a trend until the data settles.
Ferrous scrap: where it goes
Australia's ferrous scrap is sold almost entirely into South and South-East Asia. In 2025-26 five countries took 86.5 percent of the tonnage: Bangladesh (805,000 tonnes, 31.6 percent), Indonesia (506,000, 19.9 percent), Vietnam (404,000, 15.9 percent), India (290,000, 11.4 percent) and Thailand (199,000, 7.8 percent). Thirty countries received some ferrous scrap [1].
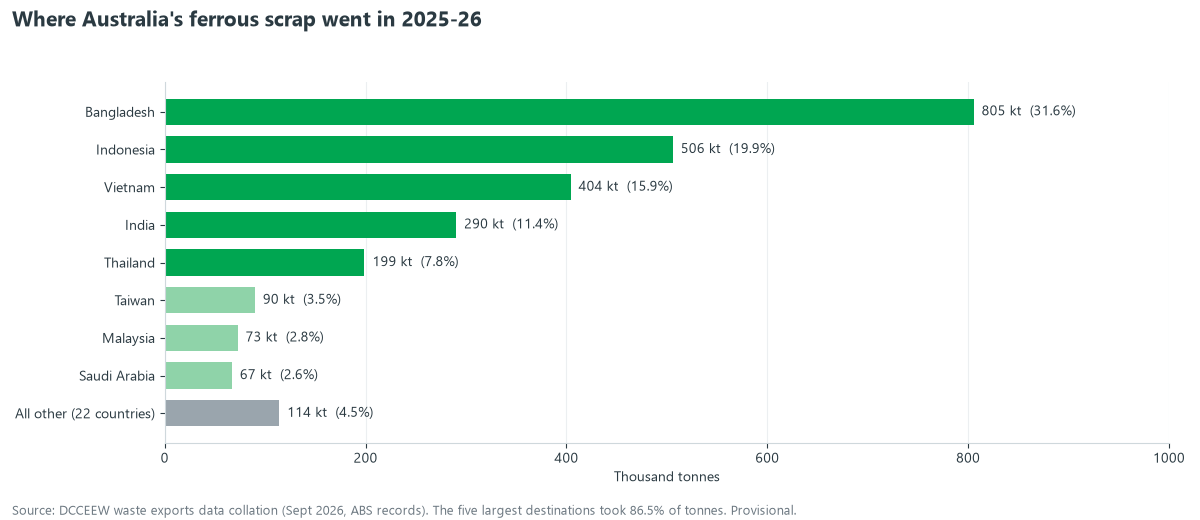
The mix has shifted sharply. In 2017-18 Vietnam took 25.8 percent of Australian ferrous scrap and Bangladesh 7.4 percent. By 2025-26 Bangladesh took 31.6 percent and Vietnam 15.9 percent [1]. The lesson for sellers is that the buyer base moves, and a market that is the largest today can be the second or third within a few years.
| Ferrous product, 2025-26 | Tonnes | Average (A$ per tonne) |
|---|---|---|
| Ferrous scrap (general code) | 1,792,569 | 639 |
| Ferrous scrap and remelting ingots | 356,991 | 583 |
| Cast iron scrap | 340,425 | 454 |
| Turnings, shavings and similar | 37,609 | 376 |
| Tinned iron or steel | 20,211 | 277 |
The European Union connection
Five countries that the European Commission's draft list for metal scrap would not authorise to receive EU waste, namely India, Bangladesh, Egypt, Morocco and Pakistan, took 1.14 million tonnes, or 44.6 percent, of Australia's ferrous exports in 2025-26. The share was 49.7 percent in 2024-25 (ScrapTrade calculation from [1], with the country list from [13]). The draft list is not adopted, and it governs exports from the EU, not from Australia. If it is adopted as drafted, European scrap that can no longer go to those buyers would have to find other routes, which may increase competition for supply in the same markets. That is an inference, not a forecast. Our separate analysis of the proposal is in Europe Is Keeping Its Scrap. Who Pays?.
Non-ferrous scrap: where the value goes
| Destination, 2025-26 | Share of non-ferrous value | Share of copper value | Share of aluminium value |
|---|---|---|---|
| China | 32.5% | 56.0% | 21.2% |
| India | 18.4% | 11.3% | 29.2% |
| South Korea | 16.7% | 10.4% | 19.2% |
| Thailand | 11.1% | 17.1% | 8.8% |
| Belgium | 3.8% | n/a | 7.1% |
China takes just over half of copper scrap by value (56 percent) but only 34 percent by weight, which suggests it receives the higher-value material. Thailand takes a quarter of copper scrap by weight (25.5 percent) and 17 percent by value. For aluminium, India is the largest buyer by value (29 percent), ahead of China and South Korea [1]. Together, China, India, South Korea and Thailand take about 79 percent of non-ferrous value, a concentration worth noting for any exporter or policymaker.
Copper is also a global story. The International Copper Study Group's data, as reported by Recycling Today, put secondary copper at about 16.9 percent of world refined copper output in 2023, roughly 4.55 million tonnes [9]. Scrap is a significant but minority source, which is part of why copper scrap commands such a premium.
Where it comes from and leaves
| State of origin, 2025-26 | Million tonnes | A$ billion | Average (A$ per tonne) |
|---|---|---|---|
| Victoria | 0.67 | 1.27 | 1,894 |
| Queensland | 0.86 | 1.13 | 1,318 |
| New South Wales | 0.47 | 1.03 | 2,166 |
| Western Australia | 0.79 | 0.79 | 994 |
| South Australia | 0.17 | 0.30 | 1,804 |
| Northern Territory | 0.05 | 0.03 | 490 |
Victoria earned the most from scrap exports, and New South Wales earned the most per tonne, which points to a richer mix of non-ferrous metal. Western Australia shipped the second-most tonnage but earned the least per tonne among the larger states, which fits a ferrous-heavy mix. By port, Sydney (A$1.12 billion), Melbourne (A$1.09 billion) and Brisbane (A$0.98 billion) led by value, with Brisbane loading the most tonnes (0.75 million) [1]. These are mix effects inferred from the averages, not separate measurements.
What the policy framework covers
Australia restricts the export of some waste, and metals are not among the restricted materials. The bans, introduced in stages under the Recycling and Waste Reduction Act, cover glass (from January 2021), mixed plastics (July 2021), whole tyres (December 2021), single-resin plastics (July 2022) and mixed paper and cardboard (July 2024) [3]. The Senate Environment and Communications References Committee's waste inquiry, "No time to waste", was tabled on 24 April 2025 with 19 recommendations. None concerns scrap metal, and its only recommendation on exports asks that export fees not impede the export of valuable commodities. At the time of our check on 21 October 2026, no government response was listed on the inquiry page [3].
On the minerals side, copper and aluminium are on the government's Strategic Materials List, which also includes phosphorus, tin and zinc, and the list page does not mention recycling or scrap [4]. We read all 18 pages of the Critical Minerals Strategy 2023-2030 and found no mention of scrap metal or metal recycling [4]. The National Waste and Resource Recovery Report 2026, published by DCCEEW on 22 September 2026, reports that 56 percent of recovered metals were exported for recycling in 2024-25 [2].
None of this makes scrap policy absent in every respect. Packaging, product stewardship and state licensing rules all touch the trade. The narrower point is that the specific question of whether and how Australia should keep scrap metal onshore does not appear in the export bans, the Senate recommendations or the two main critical-minerals documents we checked.
The domestic side: demand and processing capacity
Steel
Steelmaking is moving towards the electric arc furnace, which runs mainly on scrap. Electric arc furnaces made 30.3 percent of the world's crude steel in 2025, up from 29.1 percent in 2024, and world steel scrap use was about 630 million tonnes, according to worldsteel figures reported by EUWID and GMK Center [8]. World crude steel output was about 1.85 billion tonnes in 2025 on secondary reports of worldsteel data.
Australia's own steelmaking is changing. Reports from mid-September 2026 say the 60-year-old blast furnace at Whyalla will not be restarted and that the government will not fund a restart, with about 500 jobs to go and a sale process continuing [11]. Any return to steelmaking at Whyalla depends on new production facilities, and earlier plans involved replacing the blast furnace with an electric arc furnace. BlueScope's Port Kembla works is the remaining blast-furnace steelworks. In 2021 BlueScope said it planned to reline a second furnace there, and that replacing a blast furnace with an electric arc furnace would be inefficient because of high electricity costs and limited scrap availability in Australia [12].
The Australian Steel Institute, the industry body, takes a different view of scrap availability. In its updated submission to the Senate inquiry (September 2024) it estimated that over 1.05 to 1.1 million tonnes of unprocessed steel scrap, from end-of-life vehicles and white goods, is exported each year, including over 250,000 tonnes of materials whose export is banned on their own, such as plastics, glass and tyres. It said local mills would need another 500,000 tonnes of scrap a year within three years and 2.5 million tonnes a year within three to ten years, and estimated that a ban would save 1.2 million tonnes of carbon dioxide equivalent a year [5]. These are the Institute's own estimates and cannot be checked against the export records, which do not distinguish processed from unprocessed material.
Aluminium
Aluminium is the clearest case of an export gap. Australia produces about 25 percent of the world's bauxite, is the second-largest alumina producer with more than 13 percent of world supply, and makes about 1.5 million tonnes of primary aluminium, 2 to 3 percent of world output [6]. A 2026 report by L.E.K. Consulting for the Australian Aluminium Council estimates that Australia generates about 440,000 tonnes of aluminium scrap a year and exports almost all of it for remelting abroad. It says Australia cannot currently recycle end-of-life aluminium into equivalent new products [6].
The same report sets out why. Scrap prices sit above 90 percent of the London Metal Exchange benchmark, which leaves little margin for a local remelter once transport and energy costs are counted. Mixed-alloy scrap and limited pre-treatment infrastructure add technical difficulty, and collecting beyond about 500 kilometres is uneconomic without support. It notes that the Recycling Modernisation Fund excludes aluminium. It estimates that remelting just 40,000 tonnes of pre-consumer scrap, about 10 percent of arisings, could support more than 130 jobs and as much as A$300 million in economic value [6].
The two aluminium numbers should be read with care. The L.E.K. estimate of annual arisings (about 440,000 tonnes) is a different measure from the export record, which showed 569,000 tonnes in 2024-25 and 378,000 tonnes in 2025-26 [1][6]. They are the same order of magnitude, but they are not the same thing, and the difference is another sign of how thin the published data on domestic scrap generation is.
Copper
Australia's primary copper processing base is itself under strain. In October 2025 Glencore signed a Heads of Agreement with the federal and Queensland governments for up to A$600 million to keep the Mount Isa copper smelter and Townsville copper refinery operating for three years, after a strategic review that began in April 2025 [10]. We found no source describing the extent of domestic copper scrap processing, which is itself a data gap. What the export record shows is that Australia sold about 113,000 tonnes of copper and copper-alloy scrap abroad in 2025-26 for A$1.23 billion.
Energy and emissions
The environmental case for recycling is strongest for aluminium. The International Aluminium Institute puts the average energy to make primary aluminium at 186 gigajoules a tonne in 2019, against about 8.3 gigajoules for recycled metal, a saving of about 95.5 percent. It notes that this recycled figure rests on regional datasets because no global estimate exists [7]. A later IAI update gives a carbon footprint of 15.1 tonnes of CO2e per tonne for primary aluminium in 2022, against 0.52 tonnes for gate-to-gate recycling, though it warns the recycling figure should not be read as the full footprint of recycled metal [7].
How other countries have handled the question
The L.E.K. report reviewed international approaches to keeping scrap onshore, and its findings are the most direct evidence available on what restrictions do in practice [6].
| Country or region | Measure | Reported outcome |
|---|---|---|
| South Africa | 2013 price preference system: exporters must first offer scrap to domestic buyers at 75% of the LME price | Cheaper scrap for local processors, but no large-scale investment, exporter closures, and the scheme was under formal review in 2025 |
| United Arab Emirates | 2020 ban on aluminium scrap exports, replaced by an export duty in 2024 | Diverted scrap to local users but squeezed traders and collectors. The duty gave more predictable supply and coincided with a 170,000 tonne a year recycling plant at Emirates Global Aluminium, but compressed margins |
| European Union | Waste shipment rules restricting scrap exports to non-OECD countries unless they can show environmentally sound management | Industry bodies disagree: recyclers warn of lower prices and quality, while the European Aluminium association backed export fees in August 2025. Neither had been introduced at the time of the report |
| India | 2024 rules requiring recycled content in aluminium, copper and zinc products | Too early to evaluate |
| Canada and the United States | Direct capital support: CA$110 million for a Rio Tinto smelter expansion (2023); more than US$100 million for US recycling projects (2024) | Offsets energy costs and attracts private investment |
The report's conclusion is that retention measures "depress prices but don't build industry" where processing capacity does not already exist, and that direct public co-investment in remelting capacity has worked better [6]. That finding concerns aluminium. Steel is a different market, with existing mills that want more scrap, and its evidence is less settled.
Two positions in the Australian debate
| Australian Steel Institute | Australian Aluminium Council (with L.E.K.) | |
|---|---|---|
| Metal | Steel | Aluminium |
| Core claim | Unprocessed scrap exports hide banned waste, and local mills will need more scrap | Almost all aluminium scrap leaves Australia because there is no remelting capacity |
| Main ask | Strong limits or a ban on unprocessed ferrous scrap exports, using existing waste regulations | Co-investment in remelt plants, recycled-content settings and better scrap data. Not an export ban |
| Source | Senate submission, 2024 [5] | Special report, March 2026 [6] |
The positions are not as far apart as they appear. Both want more material kept and processed at home. They differ on the tool, and on whether the constraint is supply (steel) or processing capacity (aluminium). Both are advocacy documents by industry bodies, and their estimates deserve the same scrutiny as any interested party's.
What the data cannot tell us
- How much scrap Australia generates and processes by grade. The export record is detailed, but we found no equivalent published series for domestic arisings or processing, so the share of scrap that stays onshore cannot be calculated from public data.
- How processed the exported material is. The customs codes do not separate shredded and graded scrap from unprocessed material.
- What a ban or fee would do to prices. We have not modelled it, and the international examples cover aluminium rather than steel.
- The final state of the latest year. 2025-26 may be revised.
- The Steel Institute's claim about the number of countries that limit scrap exports. The Institute cites 71 countries but its own footnote refers to a count of 43, so we have not used it.
What this means for people who trade scrap
- Grade is the lever. A tonne of clean copper alloy and a tonne of mixed ferrous differ in value by a factor of about 18, so accurate sorting and description matter more than volume. See how to grade scrap metal.
- Check the day's price. Prices move constantly, and the nine-year average hides large swings. Use the live material prices, including bare bright copper, aluminium extrusion and HMS 1.
- Know your destination risk. With four to five countries taking most of each metal, a policy change in one market can move prices. For cross-border deals read the real cost of sourcing scrap abroad and trading scrap internationally.
- Compare offers. Where several buyers can see a listing, the price reflects competition. Browse the marketplace to see how material is listed.
Frequently asked questions
How much scrap metal does Australia export?
In 2025-26 Australia exported 3.05 million tonnes of metal scrap worth A$4.58 billion, of which 2.55 million tonnes was ferrous, according to DCCEEW's collation of ABS data. The figures are provisional [1].
Is there a ban on exporting scrap metal from Australia?
No. Australia's waste export bans cover glass, plastics, tyres and paper and cardboard. Metals are not covered [3]. The Australian Steel Institute has proposed limits on unprocessed ferrous scrap, but no such measure has been adopted [5].
Which scrap metal is most valuable?
Per tonne, precious-metal and platinum-group scrap, then copper and copper alloys at about A$10,800 a tonne, then aluminium at about A$3,790, against about A$600 for ferrous scrap. By total value in 2025-26, aluminium (A$1.43 billion), ferrous (A$1.53 billion) and copper (A$1.23 billion) were similar [1].
Where does Australian scrap metal go?
Ferrous scrap goes mainly to Bangladesh, Indonesia, Vietnam, India and Thailand. Non-ferrous scrap goes mainly to China, India, South Korea and Thailand [1].
Why does non-ferrous scrap matter more than its weight suggests?
Because it is worth far more per tonne. Non-ferrous metals were 16 percent of export weight but 67 percent of export value in 2025-26 [1].
How reliable is the data?
It is official trade data compiled from exporters' declarations. DCCEEW warns that codes and values may be misreported and that the figures can be revised for up to six months, so the latest year is provisional [1].
Method and sources
All export figures are ScrapTrade's analysis of the 75,785 export records in DCCEEW's September 2026 waste exports data collation, restricted to the "Metals" category and grouped by the department's classification into iron and steel, aluminium and other non-ferrous metals [1]. Percentages are calculated from tonnes or declared value as stated. Averages are total declared value divided by total tonnes. Where a figure comes from a report or a news article rather than the export data, the reference is shown in square brackets.
References
- Department of Climate Change, Energy, the Environment and Water (DCCEEW), Waste exports data collation, September 2026, using Australian Bureau of Statistics export records for 2017-18 to 2025-26.
- DCCEEW, National Waste and Resource Recovery Report 2026, published 22 September 2026.
- Parliament of Australia, Senate Environment and Communications References Committee, waste reduction and recycling inquiry: Chapter 7, Chapter 8, list of recommendations and the inquiry page, checked 21 October 2026.
- Department of Industry, Science and Resources, Critical Minerals List and Strategic Materials List (updated 20 February 2024) and Critical Minerals Strategy 2023-2030.
- Australian Steel Institute, updated submission to the Senate inquiry into waste reduction and recycling policies (September 2024), published by the Institute; see also Argus Media, 18 April 2024.
- Australian Aluminium Council and L.E.K. Consulting, Enabling Development of Aluminium Recycling Capability in Australia, special report, March 2026.
- International Aluminium Institute, Aluminium recycling saves 95% of the energy needed for primary aluminium production.
- EUWID Recycling and Waste Management, Scrap use in global steel production rises in 2025 (June 2026); GMK Center, The share of EAF in global steel production in 2024 increased to 29.1%, citing worldsteel.
- Recycling Today, Copper recycling secondary output 2023 rising, citing the International Copper Study Group.
- Glencore Australia, Agreement reached on Mount Isa Copper Smelter and Townsville Copper Refinery.
- SteelOrbis, Whyalla Steelworks to permanently close BF and cut 500 jobs; RenewEconomy, Administrators call time on Whyalla steelworks coal furnace delusion.
- Argus Media, Green steel 20 years away: BlueScope Steel (2021).
- Argus Media, EU proposes scrap export restrictions to key markets, 19 September 2026.
Compiled by ScrapTrade and last updated on 22 October 2026. ScrapTrade operates an online scrap metal marketplace and has a commercial interest in the scrap trade, including exports. This article is general information, not financial, legal or investment advice. Figures are as published by the sources named above, and the latest financial year is provisional and may be revised.