

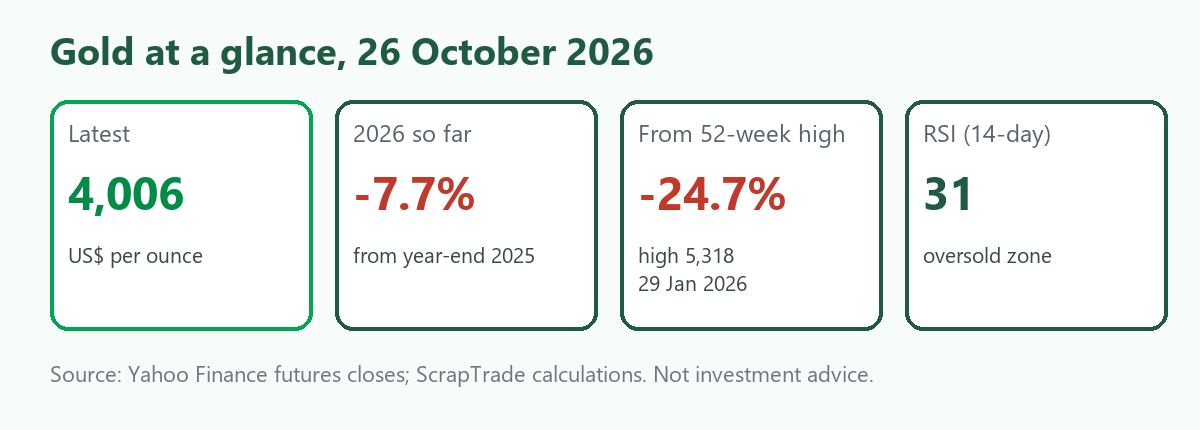
Updated 26 October 2026. A year ago, gold was a one-way bet. It rose 64% across 2025, and in late January it pushed through US$5,000 an ounce on its way to a record close of US$5,318 on 29 January (intraday highs near US$5,590 have been reported). The next day it fell 10.8% in a single session, the worst day in ten years of data. Since then the story has been a long, uneven slide. On 23 October spot gold briefly traded below US$4,000 for the first time since mid-July, and COMEX gold closed on 26 October at US$4,006, about A$5,697 an ounce at an exchange rate of 70.3 US cents [1][2]. That is 25% below the January peak, and it has left a lot of people asking whether this is a correction inside a bull market or the end of one.
This piece sets out how gold got here, what is driving it, what the standard technical indicators are saying, what the fall looks like in Australian dollars, and what to watch next. It also explains what the price means if you are holding jewellery or other gold scrap. Nobody knows where gold goes from here, and this is not investment advice.
How gold got here
The run-up was extraordinary. COMEX gold ended 2024 near US$2,640 and 2025 at US$4,341, and then added another 22% in four weeks to January's record. Silver and platinum did the same, only more violently. The reversal began on 30 January and has not really stopped.
| Month-end close (US$ an ounce) | |
|---|---|
| December 2025 | 4,341 |
| January 2026 | 4,745 |
| February 2026 | 5,248 |
| March 2026 | 4,648 |
| April 2026 | 4,630 |
| May 2026 | 4,593 |
| June 2026 | 4,039 |
| July 2026 | 4,107 |
| August 2026 | 4,482 |
| September 2026 | 4,187 |
| October 2026 (to the 26th) | 4,006 |
After the late-January shock, gold bounced back to US$5,248 by the end of February, then lost 11% in March and drifted lower for most of the next seven months, with a rally in August that faded. It fell more than 8% in September alone, according to market reports [3]. The 5-year gain is still 123%, which is a useful reminder of how far it ran.
What drove the fall
Several forces have hit the metal at once, and the commentary is consistent about what they are.
- Inflation fears and higher interest rates. Reports say US 10-year Treasury yields topped 5% in September and the Federal Reserve raised rates, with policymakers divided on what comes next. Gold pays no interest, so higher yields make it less attractive. Prediction markets lean towards the Fed holding at its 28 October meeting [3].
- Oil. Reuters-based coverage links the latest leg down to oil near US$102 a barrel, which revived inflation fears. On 23 October gold fell alongside stocks and bonds as investors sold liquid assets for cash, so gold failed in its usual role as a safe haven on the day [3].
- A firmer dollar. Reuters attributed earlier pressure to a stronger US dollar. The dollar index closed at 101.6 on 26 October, in a 52-week range of 95.6 to 103.0 [2].
- Forced selling. One report notes that gold ETFs added more than 70 tonnes in a month in which gold fell more than 8%, which the World Gold Council called highly unusual. The implication is that futures liquidation overwhelmed fund buying [3].
Behind these sits the war in the Gulf, which began in late February and which, according to market reports, has pushed up oil, freight and inflation expectations across commodity markets. For the copper side of that story see Copper Prices: Analysis, Risks and Outlook.
Who is still buying
The physical market looks healthier than the price. The World Gold Council's second-quarter report found total demand flat at 1,269 tonnes, with first-half demand up 2% to 2,522 tonnes, worth US$380 billion. The pieces are moving in different directions [4].
| Q2 2026 | What happened |
|---|---|
| Central banks | Net purchases of 289 tonnes, up 62% on a year earlier. A WGC survey found 45% of central banks plan to add to reserves over the next 12 months |
| Investment | 262 tonnes in total, with 45 tonnes flowing out of gold ETFs in the quarter. Bar and coin demand was down just 3% |
| Jewellery | Volumes down 17% to about 278 tonnes as high prices bit. The value of jewellery demand still rose 22% in the first half, to US$86 billion |
| Recycled gold | The WGC saw little sign of recycling increasing |
Two points stand out. Central banks, the buyers least sensitive to price, are still adding, and the WGC expects them to stay significant buyers, though at a slightly slower pace than in the last four years. And jewellery buyers have pulled back, which matters because jewellery is the largest source of gold scrap.
What the chart says
Technical analysis reads the price record for trend, momentum and the levels where buyers and sellers have acted before. It cannot see a Fed decision or an oil shock, and the indicators often disagree. These figures are calculated from COMEX daily closes.
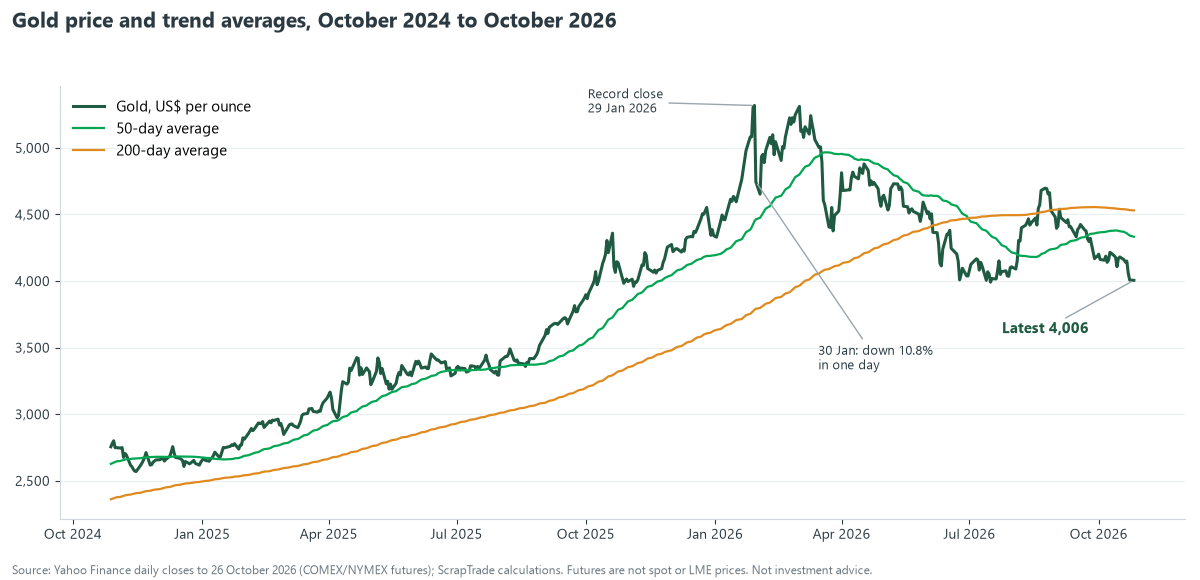
Trend. Gold is below all of its major moving averages. The latest close of 4,006 is 3.4% below the 20-day average (4,147), 7.6% below the 50-day (4,333), 5.9% below the 100-day (4,257) and 11.6% below the 200-day (4,531). The 50-day average crossed below the 200-day on 1 July, a bearish signal chartists call a death cross, and has stayed below it since.
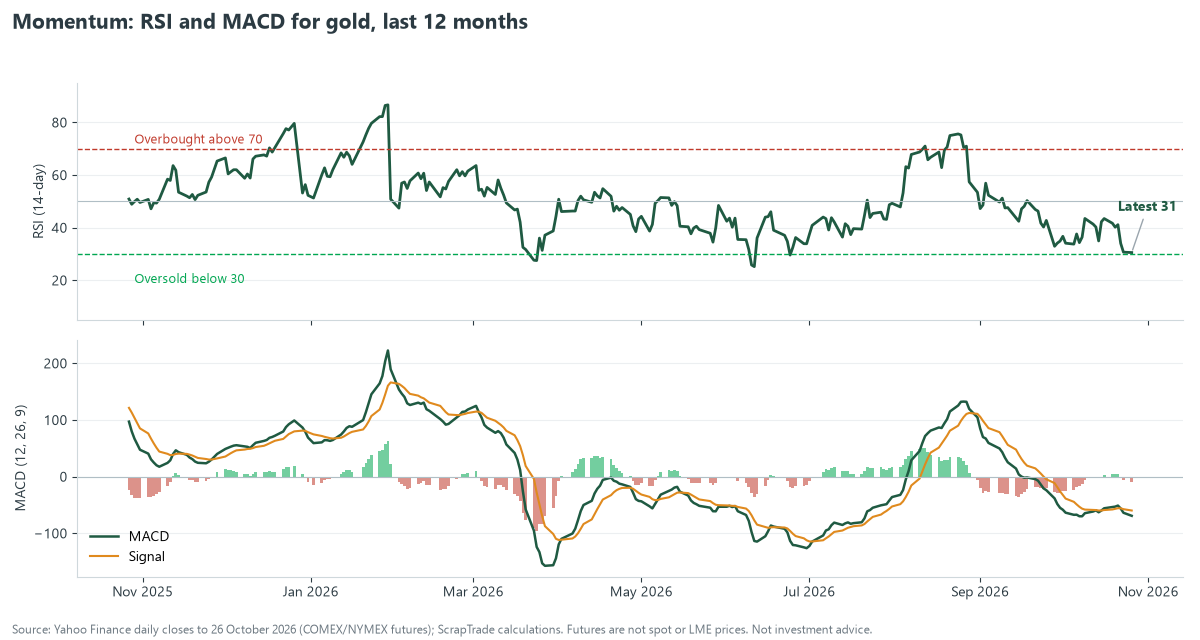
Momentum. The 14-day relative strength index is 30.6, right on the edge of the oversold zone (below 30). The MACD, which compares short and long-term momentum, is at minus 69, below its signal line at minus 60, so downward momentum has not yet turned. The Bollinger band, a volatility envelope, runs from 4,030 to 4,265, and gold is closing just under its lower edge, which often precedes either a bounce or a further stretch lower.
Levels. Price has sat at or near its 60-day low for the last few sessions. Support lies at about 3,992 (the lowest close in the last 120 trading days) and 3,960 (the 52-week low close, set on 4 November 2025). Resistance is stacked above at 4,147, 4,333, 4,531 and the 60-day high of 4,698.
Volatility. An average day's range is about 68 dollars, or 1.7%. The 30-day annualised volatility is 17%, calmer than the 28% of the past year, which includes the January shock.
| Calendar year | Change in COMEX gold |
|---|---|
| 2020 | +24.7% |
| 2021 | -3.5% |
| 2022 | -0.1% |
| 2023 | +13.4% |
| 2024 | +27.5% |
| 2025 | +64.4% |
| 2026 so far | -7.7% |
Read together, the indicators describe a market that is oversold and in a downtrend at the same time. That combination can resolve in either direction, which is why traders watch the 3,960 to 3,990 area closely: a clear break below it would damage the technical picture, while a recovery above the 20-day average would suggest the worst is over for now.
What it looks like in Australian dollars
The Australian dollar has risen about 8% against the US dollar over the past year, from 65.1 to 70.3 US cents. That cushions the cost of imports, and it works against anyone selling gold in Australia, because a stronger local currency means a smaller price in dollars.
| In US dollars | In Australian dollars | |
|---|---|---|
| Gold price, 26 October 2026 | US$4,006 an ounce | A$5,697 an ounce, or A$183 a gram |
| Change in 2026 so far | -7.7% | -12.1% |
| Change over 12 months | -3.2% | -10.5% |
| Record close | US$5,318 on 29 January | A$7,581 on 28 January |
In other words, an Australian holder is down more than a US holder, and the price is about A$1,900 an ounce below the record. Australia is also a producer: Surbiton Associates put 2025 output at about 303 tonnes, valued at A$71 billion, with gold the country's fourth most valuable export in 2024-25 behind iron ore, coal and LNG. Output remains below the 328-tonne record of 1999-2000, and high prices have encouraged miners to process lower-grade ore [5].
What it means if you hold gold scrap
Jewellery and other gold scrap is priced from the gold content, which depends on the carat (karat) mark, and refiners and dealers pay a share of the spot value, not the whole of it. The table shows the gold content of a 10 gram item at the 26 October price. It is the metal value before any dealer margin, testing or refining charges, so a real offer will be lower.
| Carat | Gold content | Pure gold in 10 g | Value at A$183.16 a gram |
|---|---|---|---|
| 9ct | 37.5% | 3.75 g | A$687 |
| 14ct | 58.5% | 5.85 g | A$1,072 |
| 18ct | 75% | 7.5 g | A$1,374 |
| 22ct | 91.6% | 9.16 g | A$1,678 |
| 24ct | 99.9% | 9.99 g | A$1,830 |
Some practical points for sellers:
- Know the weight and the mark. Weigh the item on a scale that reads in grams, and read the carat stamp. Stones and clasps are not gold, so ask how they are treated.
- Compare quotes. Dealers differ in how much of the spot value they pay. Get more than one offer, and ask what the percentage is.
- Do not chase the price. A fall from a record does not mean the price must recover. Sell for a reason you can defend, not to time a bottom.
- Expect to show ID and keep records. Buying gold from the public is regulated in many places, and honest dealers will ask for identification. Check your state or territory rules.
- Do not forget the gold in electronics. Small amounts sit in circuit boards, contacts and connectors, which is part of why e-waste is worth sorting.
For other scrap you can compare what you hold against the live price calculator, which gives indicative figures only, and list it on the marketplace.
What to expect
Forecasters are split, and the split is informative. Morgan Stanley has called US$4,000 "quite a strong floor". CPM Group, in contrast, names US$3,800 and US$3,500 as support levels and expects prices to keep falling until the US congressional elections, about ten days away. Other analysts describe the pullback as a cooling-off after a steep run rather than a change in trend [3].
| Scenario | What would have to happen | What it would mean |
|---|---|---|
| Floor holds | Inflation fears ease, the Fed pauses, oil retreats, central banks keep buying | A range between roughly 3,950 and 4,350, with the 20 and 50-day averages as ceilings |
| Further slide | Yields and the dollar keep rising, funds keep selling, oil stays high | A test of 3,800 and possibly 3,500, the levels CPM names |
| Sharp recovery | A dovish turn from the Fed, a geopolitical shock that revives safe-haven demand, or a rush of central bank buying | A retest of the 200-day average near 4,500 and then the 4,700 area |
We do not put odds on these. They show what would need to change.
Signposts to watch. The Federal Reserve's decision on 28 October. The US congressional elections on 3 November. The US 10-year yield and the dollar index. Oil and any news from the Strait of Hormuz. Gold ETF flows. The World Gold Council's third-quarter report on central bank buying and jewellery demand. And the 3,960 to 3,990 and 4,147 levels on the chart.
Frequently asked questions
What is the gold price in Australian dollars today?
About A$5,697 an ounce, or A$183 a gram, on 26 October 2026, based on COMEX futures at US$4,006 and an exchange rate of 70.3 US cents. Retail and spot prices differ slightly from futures.
Why has gold fallen?
Reports point to higher US yields and a firmer dollar, an oil-driven jump in inflation fears, a Fed that has raised rates, and forced selling that overwhelmed fund and central bank buying [3].
Is gold in a bear market?
It is about 25% below its January record, a decline that many define as a bear market, though the five-year gain is still 123%. Whether it is a correction or a trend change is the debate.
How much is a gram of 18 carat gold worth?
At the 26 October price, the gold content of one gram of 18ct jewellery is worth about A$137, before dealer margins and other charges.
Where will gold go next?
Analysts disagree. Morgan Stanley sees US$4,000 as a strong floor, while CPM Group names US$3,800 and US$3,500 as levels it expects to be tested. See the scenarios and signposts above.
Is this financial advice?
No. It is general information.
Sources
- Yahoo Finance, COMEX gold futures (GC=F), daily history to 26 October 2026. Indicators, returns and Australian dollar conversions (with AUD/USD from Yahoo Finance) are ScrapTrade calculations.
- Trading Economics, Gold; Yahoo Finance, US dollar index (DX-Y.NYB).
- GoldSilver, Gold price outlook October 2026: pullback and Fed decision; Discovery Alert, Gold price falls below US$4,000 as oil spike triggers cash scramble, summarising Reuters. Several figures are from secondary reports and differ slightly between sources.
- World Gold Council, Gold market shows resilience as price momentum cools in Q2 2026.
- Surbiton Associates via Northern Miner, Aussie gold output rises 2% to top 300 tonnes again; Kitco, Australian gold production totals 300 tonnes, A$32.8 billion in FY 2025.
This article is general information, not investment, financial or tax advice. Prices, forecasts and news are as reported on 26 October 2026 and change quickly. Futures prices are not spot prices. ScrapTrade operates a scrap marketplace and has a commercial interest in the scrap trade.