

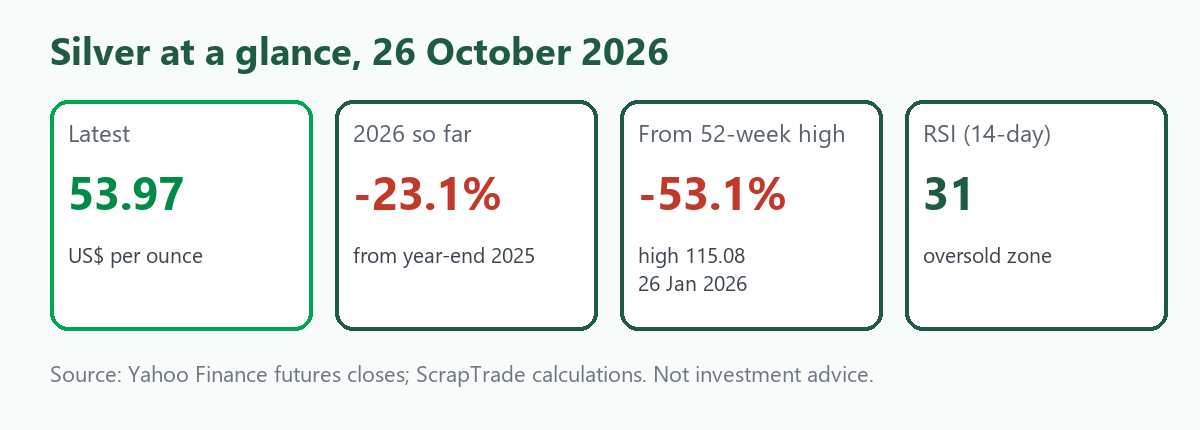
Updated 26 October 2026. If gold's fall from its January record looks dramatic, silver's looks like a different asset. Silver rose 142% in 2025, running past US$100 an ounce in January, and printed a record close of US$115.08 on 26 January. Four days later it fell 31% in one session. On 26 October COMEX silver closed at US$53.97, about A$77 an ounce, which is 53% below the January high and 23% lower since the start of the year [1].
Silver is an odd metal to analyse. It is a precious metal and an industrial one, and its price swings are about twice as wide as gold's. This article walks through what happened in January, what has driven the slide since, what the physical market looks like, what the technical indicators say, and what it means in Australian dollars and for anyone holding silver scrap. It is general information and not investment advice.
The crash that did not stay in January
Silver closed 2025 at US$70.13 and was at US$78.29 at the end of January, so the monthly figure hides what actually happened. On 30 January 2026 silver futures plunged 31.4% to settle near US$78.53, its worst day since March 1980, with intraday falls reported of 30% to 39% depending on how they are measured [2].
Reports identify several triggers that arrived at once:
- A new Fed chair. Several accounts tie the sell-off to President Trump's nomination of Kevin Warsh to lead the Federal Reserve, which investors read as a more hawkish choice and which hit commodity markets.
- A stronger dollar, which undercut the "debasement trade" that had driven the rally.
- Higher margins. The CME raised silver futures margins on 30 January, effective immediately, which forced leveraged holders to sell.
- Options and algorithms. Analysts note a record run of call-option buying that had pushed prices up mechanically, and then reversed. Some argue the move was driven by automated selling rather than any change in supply or demand.
Silver then rebounded to US$92.68 by the end of February, before sliding again. The path since:
| Month-end close (US$ an ounce) | |
|---|---|
| December 2025 | 70.13 |
| January 2026 | 78.29 |
| February 2026 | 92.68 |
| March 2026 | 74.69 |
| April 2026 | 73.53 |
| May 2026 | 75.62 |
| June 2026 | 59.48 |
| July 2026 | 57.59 |
| August 2026 | 66.22 |
| September 2026 | 60.10 |
| October 2026 (to the 26th) | 53.97 |
Silver has now given back about two-thirds of what it gained in the final quarter of 2025, when it climbed from US$46 to US$70. It is still 12% higher than a year ago and 124% higher than five years ago, which is a measure of how large the run was.
What the physical market says
The price has fallen further than the fundamentals would explain, which is a theme of the whole precious metals complex this year. The Silver Institute and Metals Focus published the 2026 World Silver Survey on 15 April. Its main findings, as reported:
- A sixth straight deficit. The market is forecast to be short by 46.3 million ounces in 2026, up from a 40.3 million ounce deficit in 2025.
- Supply grew in 2025 and is flat in 2026. Total supply rose 7% in 2025, helped by mine output and a 13-year high in recycling as elevated prices pulled scrap into the market. For 2026 mine output is forecast to be flat and total supply down about 2%.
- Demand is slipping. Total demand is forecast to fall about 2% to 1.11 billion ounces. Industrial demand, which is more than half the total, is forecast to fall 3% to 639.6 million ounces, a second consecutive annual decline.
- Solar is the weak spot. The industrial decline is mainly weaker photovoltaic demand. A secondary report puts solar-module silver use down as much as 19% in 2026, as manufacturers cut the amount of silver per panel because silver is more than 17% of module cost [3].
That picture helps to explain both sides of the debate. A persistent deficit is supportive, while falling industrial demand and a flood of recycled supply when prices were high are not. For people who trade scrap, the 13-year high in recycling is the part to remember: it is the clearest sign that high prices bring material out of drawers and old equipment.
What the chart says
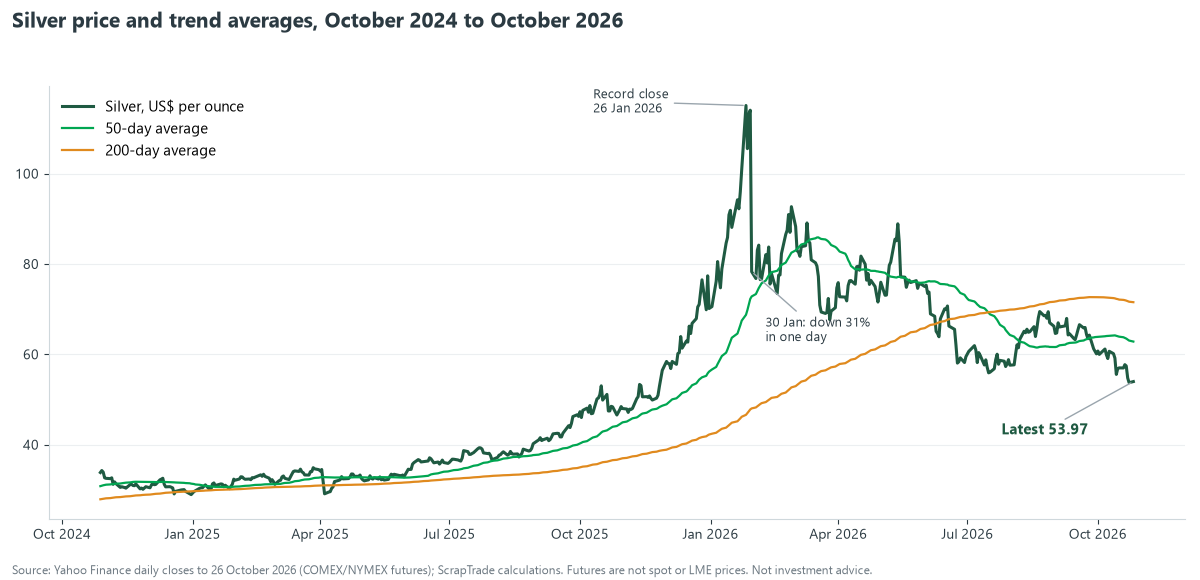
These figures are calculated from COMEX daily closes.
Trend. Silver is below every major average. The close of 53.97 is 7.5% below the 20-day average (58.32), 14.1% below the 50-day (62.82), 13.4% below the 100-day (62.31) and 24.6% below the 200-day (71.54). The 50-day average fell below the 200-day on 16 July.
Momentum. The 14-day RSI is 30.9, marginally above the oversold line. The MACD is at minus 2.24, below its signal line at minus 1.89, so selling momentum persists. The Bollinger band runs from 53.47 to 63.17, and silver is sitting on its lower edge.
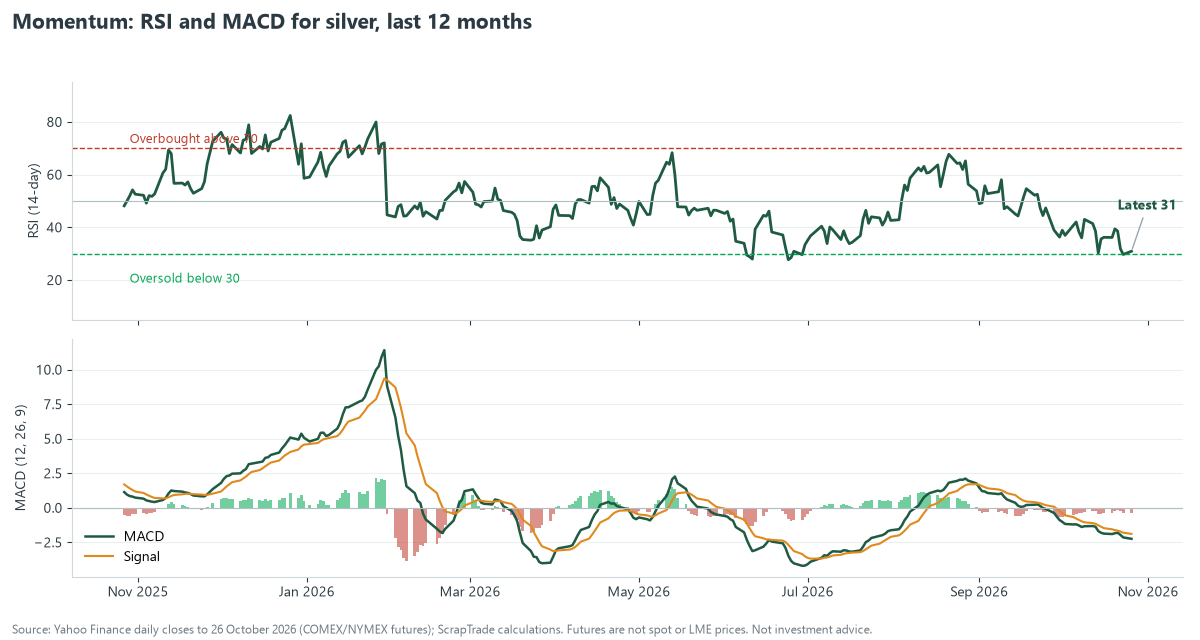
Levels. The closest support is 53.71, the lowest close of the past 60 and 120 trading days, and a break below it would put the 52-week low close of 46.56 (27 October 2025) in view. Resistance lies at 58.3, 62.8, 69.5 (the 60-day high) and 71.5.
Volatility. The average daily range is US$1.24, or 2.3% of the price, about twice gold's. The 30-day annualised volatility is 34%, and 69% over the past year, which includes the January collapse.
| Calendar year | Change in COMEX silver |
|---|---|
| 2020 | +47.7% |
| 2021 | -11.4% |
| 2022 | +2.3% |
| 2023 | 0.0% |
| 2024 | +21.3% |
| 2025 | +142.3% |
| 2026 so far | -23.1% |
Silver's pattern is clear in that table: long quiet years punctuated by violent moves. It is oversold and in a downtrend, and with a volatility of that size neither a 20% bounce nor a further 20% fall would be out of character.
In Australian dollars
With the Australian dollar at 70.3 US cents, up about 8% in a year, silver is A$77 an ounce, or about A$2.47 a gram. A year ago it was about US$48 an ounce. For Australian holders the fall since January is slightly steeper than in US dollars, because the stronger local currency takes a further bite.
Silver scrap is mostly jewellery, cutlery, coins and electronics, and the key number is the silver content. Sterling silver is 92.5% pure, so at the 26 October price a 100 gram item holds about 92.5 grams of silver, worth about A$228. That is the metal value before the dealer's margin, testing and refining costs.
| Item | Silver content | Metal value at A$2.47 a gram |
|---|---|---|
| 100 g of sterling silver (925) | 92.5 g | A$228 |
| 1 kg of sterling silver | 925 g | A$2,283 |
| 100 g of fine silver (999) | 99.9 g | A$247 |
For items that are not stamped, ask a dealer to test them. Plated items contain very little silver. Dealers pay a share of the metal value, so compare quotes, and keep a receipt. Buying precious metals from the public is regulated in many places, so expect to show identification. See the live price calculator for other scrap, and note that electronics contain small amounts of silver in contacts and boards, a good reason to sort e-waste.
What to expect
We found few reliable current forecasts for silver, and none that we would call authoritative, so this section is deliberately modest. The mainstream view is that the market remains in structural deficit but that investment flows and the dollar are in charge of the short-term price. Two former strategists who had been bearish turned bullish for a short-term bounce after the January crash [2].
| Scenario | What would have to happen | What it would mean |
|---|---|---|
| Stabilise | The dollar stops rising, the Fed pauses, funds stop selling | A range between about 52 and 62, capped by the 20 and 50-day averages |
| Further fall | Yields and the dollar rise, industrial demand disappoints | A test of the 46.56 low and possibly lower |
| Rebound | A dovish Fed, renewed safe-haven demand, deficits drawing metal | A retest of 62 to 70 |
Signposts: the Fed on 28 October and the dollar index; margin changes at the CME; solar installation data and silver thrifting; recycling volumes; ETF flows; and the 53.7 and 58.3 levels on the chart.
Frequently asked questions
What is the silver price in Australian dollars today?
About A$77 an ounce, or A$2.47 a gram, on 26 October 2026, based on COMEX futures at US$53.97.
Why did silver crash in January?
Reports cite the nomination of Kevin Warsh as Fed chair, a stronger dollar, higher CME margins and the unwinding of a record run of call-option buying, which together forced leveraged holders to sell [2].
Is there a silver shortage?
The 2026 World Silver Survey forecasts a sixth consecutive deficit, of 46.3 million ounces in 2026. Industrial demand is forecast to fall, however [3].
How much is sterling silver worth?
At the 26 October price, a gram of sterling (92.5% silver) holds about A$2.28 of silver, before dealer margins.
Where is silver heading?
Nobody knows. Silver is highly volatile, oversold on some indicators and in a downtrend on others.
Sources
- Yahoo Finance, COMEX silver futures (SI=F), daily history to 26 October 2026. Indicators, returns and Australian dollar conversions (using AUD/USD) are ScrapTrade calculations.
- TheStreet, Silver bears drop bombshell reversal after record 31% crash; Finance Magnates, Why silver price crashed 33% today; Upstox, Silver price crash: why precious metals witnessed one of the worst corrections in decades. Figures vary by source.
- Silver Institute and Metals Focus, World Silver Survey 2026 (15 April 2026), as reported by Mexico Business News, Crux Investor and SMM. The 19% solar figure is from a secondary report.
This article is general information, not investment, financial or tax advice. Prices and news are as reported on 26 October 2026 and change quickly. Futures prices are not spot prices. ScrapTrade operates a scrap marketplace and has a commercial interest in the scrap trade.