

Plastic bottles are the part of the kerbside bin most people feel sure about. The label has a number on it, the bottle is rinsed and it goes in. This guide follows one bottle from the bin to a sorter, a bale and a reprocessor, and shows where it goes, how Australia's plastic export bans in 2021 and 2022 changed the trade and how much of it really comes back as plastic. It is written for households, for businesses that generate bottle waste and for collectors who bale it. The export figures are our analysis of government records, and ScrapTrade operates a scrap marketplace and has a commercial interest in the scrap trade.
Step 1: It goes in the bin, or back to a refund point
A bottle can leave the home by two routes. In the kerbside bin it joins all the other recyclables. In a state with a container deposit scheme, an eligible drink bottle can instead be returned for a 10 cent refund, and a bottle collected that way arrives at the recycler already separated from paper and glass. Return and Earn in New South Wales reports that two in three eligible drink containers supplied there are now redeemed. That figure covers all eligible containers and not plastic bottles alone, and we found no PET-only rate.
The lid is where councils disagree. Maroondah says plastic lids can stay on if you squash the air out first, Brisbane City Council is reported to ask for lids on, and Murray River Council lists bottles as accepted with lids off. In the ACT a lid larger than a credit card can go in the bin, though people are asked to take it off, and Kalamunda says small lids belong in general waste, at a transfer station or at a Containers for Change point. There is no national rule, and the Australian Council of Recycling has pointed people to the Recycle Mate app or their council. We found little on labels beyond one article saying tamper-proof rings and plastic-coated labels do not wash off and can contaminate the process.
Step 2: A sorter separates the resins
Plastic needs a finer sort than paper, because a bottle is only recyclable into a bottle if it is the right plastic. The resin identification code on the base gives the type, and the two you will see most on bottles are 1, polyethylene terephthalate (PET), used for drink and some food bottles, and 2, high-density polyethylene (HDPE), used for milk and detergent. The one description we found is from the Albury PET plant, which says it uses infrared and optical sorters to keep the resin pure, and we could not find a neutral account of how the average sorting facility does it. The code says what the plastic is made of, and not whether your council takes it.
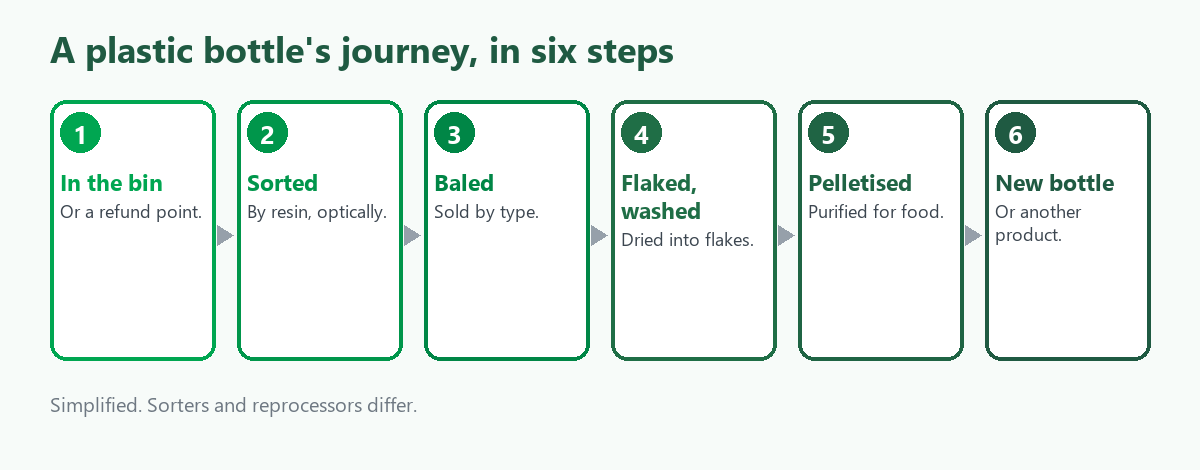
Step 3: It is baled and sold by resin
Sorted plastic is pressed into bales and sold by type. The customs records use the same logic: since July 2021 the export lines have been split by resin, with separate lines for PET, for polyethylene with a specific gravity of 0.94 or more (the range of HDPE) and for polyethylene under 0.94 (the range of LDPE), for polypropylene, polystyrene and PVC. These lines are the scrap, not the bottles: the PET line includes any PET scrap, such as trays, and the HDPE line is not limited to bottles. We use them as the nearest available measure.
Step 4: Most of what used to leave has stopped
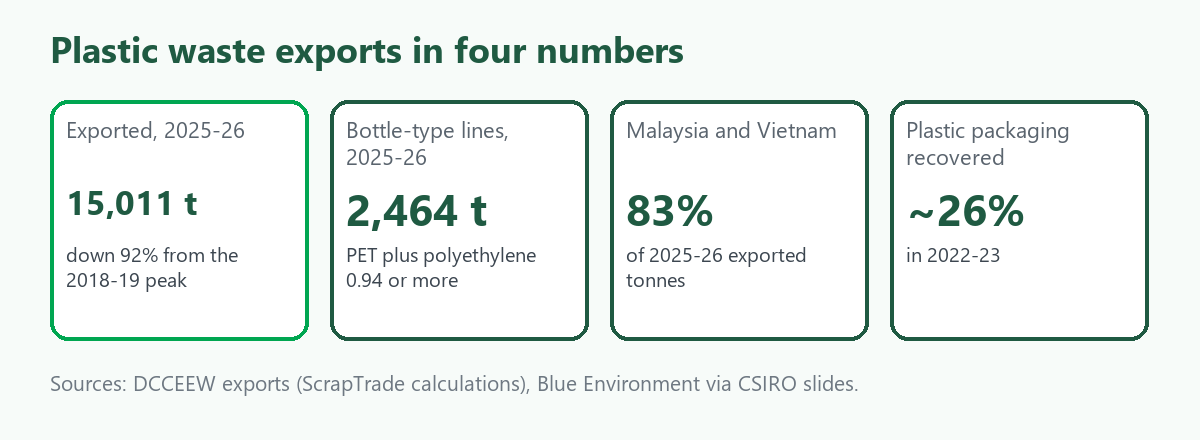
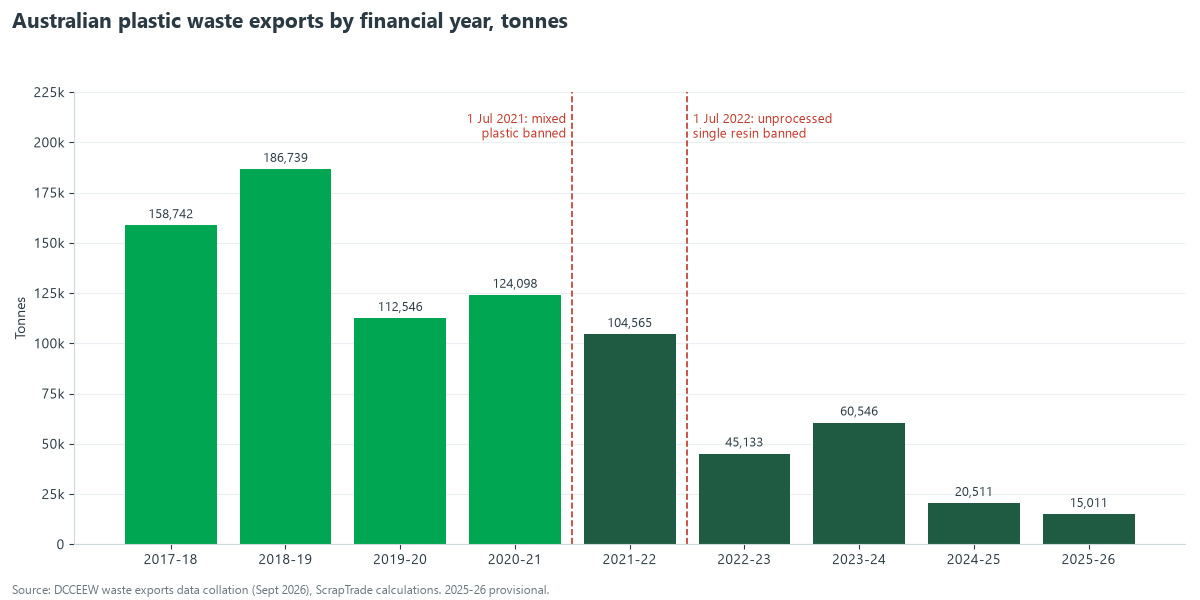
In 2017-18 Australia exported 158,742 tonnes of waste plastic, and in 2018-19 it exported 186,739 tonnes, the highest in our records. In 2025-26 (provisional) it exported 15,011 tonnes, 92 percent below that peak and 90.5 percent below 2017-18, with a declared value of A$4.97 million. In 2017-18 the main destinations were Malaysia (31.4 percent), Indonesia (19.1 percent), China (17.0 percent) and Thailand (16.9 percent). By 2025-26 China and Thailand had dropped out of the records, and the remaining tonnes went to Malaysia (41.8 percent), Vietnam (41.2 percent) and Indonesia (16.7 percent), with a very small amount to Pakistan.
What changed in 2021 and 2022
The Commonwealth banned the export of waste plastic in two stages. From 1 July 2021, mixed plastic that was not sorted into a single resin or polymer type, or processed into a value-added material, could not be exported. From 1 July 2022, the ban extended to single-resin plastic that had not been further processed. Since then exports are limited to plastic sorted into a single resin and processed further, or processed into engineered fuel, and exporters need a waste export licence and must declare each consignment. One consultancy describes processed plastic as sorted, washed and cleaned, for example hot-washed flakes or pellets, and adds that simply shredding is unlikely to be enough. These descriptions come from a customs notice and trade summaries, and we have not read the rules themselves.
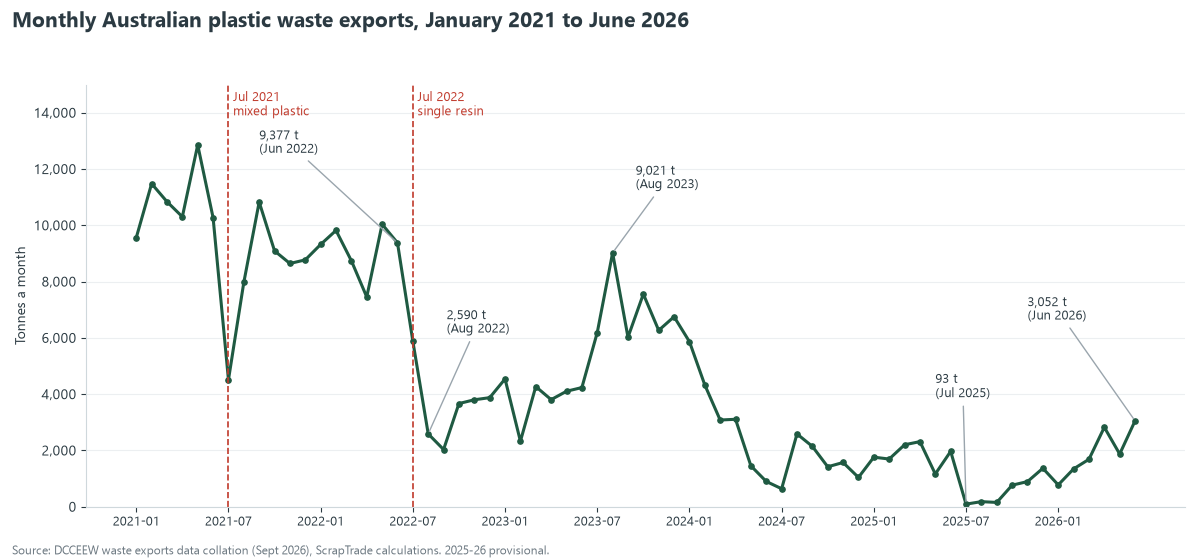
The records show a step, though not a clean one. Monthly exports were 9,377 tonnes in June 2022 and 2,590 tonnes in August 2022. They then recovered, reaching 9,021 tonnes in August 2023, before falling again to 93 tonnes in July 2025, and they have been rising since, to 3,052 tonnes in June 2026. We do not know why, and the records do not say. The declared value per tonne also moved: about A$820 in 2021-22 and 2022-23, A$426 in 2023-24 and A$331 in 2025-26. These are border declarations and not prices, and we cannot say whether the change reflects a different mix of material, the market or something else.
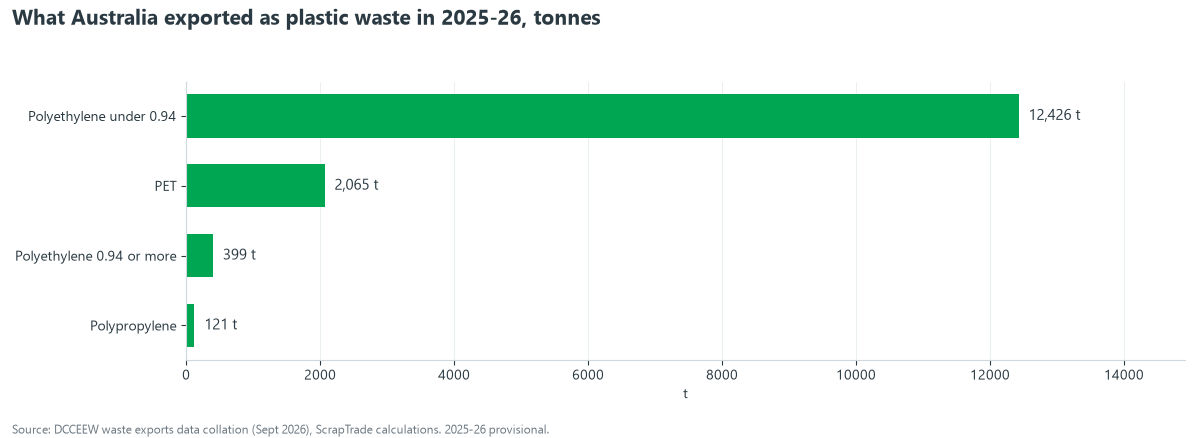
Most of what is still exported is not bottles. In 2025-26 the polyethylene line under 0.94 specific gravity was 12,426 tonnes, 82.8 percent of the total, while PET was 2,065 tonnes and polyethylene at 0.94 or more 399 tonnes. The two bottle-type lines together were 2,464 tonnes, 16.4 percent. That was down from 60,830 tonnes in 2021-22, when they were 41,209 tonnes of PET and 19,621 tonnes of polyethylene at 0.94 or more. The records cannot show where the rest of the bottle plastic went. Our export figures leave out plastic that is processed here, plastic that is landfilled or stockpiled and plastic that is exported as a finished product.
Step 5: At the reprocessor
The best-documented example is Circular Plastics Australia's PET plant at Albury-Wodonga, a joint venture of Pact Group, Cleanaway, Asahi Beverages and Coca-Cola Europacific Partners, opened in March 2022. Bottles come from container deposit schemes and kerbside bins. The plant sorts them with infrared and optical sorters, shreds and washes them, dries the result into flakes, and runs the flakes through an extrusion and purification line to make food-grade recycled PET (rPET), with a vacuum treatment step described by one trade source. It is rated at about one billion 600 ml bottles a year, or more than 20,000 tonnes of recycled resin. A second facility in Melbourne's west was scheduled to operate in 2023, and we did not confirm that it did.
HDPE and polypropylene bottles are generally washed and flaked or pelletised in a similar way, according to the sources we found, though we did not find an Australian account of those lines.
Step 6: Back into bottles, or into something else
The pellets go to a manufacturer. At Albury, Pact makes new bottles and food packaging, and Asahi Beverages and Coca-Cola Europacific Partners use the bottles for their drinks. That is the closed loop, and it depends on food-grade quality, which is why the plant has the purification step. The alternative uses are lower-grade. Overseas sources describe the main outlet for recycled PET as fibre for carpet, fleece and fill, and for recycled HDPE they list pipe, tiles, buckets, crates and bins, as well as bottles. Those sources are North American and some are dated, and we did not find an Australian breakdown.
How much really comes back?
The figures disagree, and they measure different things. Plastics Flows and Fates for 2022-23, in slides from Blue Environment, puts the recovery rate for PET at about 30 percent, HDPE at about 21 percent and LDPE at about 15 percent. It gives 26 percent for plastic packaging and 7 percent for non-packaging plastic. A trade article on the same report gives PET at 37 percent and HDPE at 20 percent, so the PET rate is somewhere between 30 and 37 percent depending on the source. The Australian Packaging Covenant Organisation says only 28 percent of rigid plastic was collected in 2022-23, and that PET recovered was 48,418 tonnes, up from 7,437 tonnes the year before. Those are different measures of different groups of plastic, and we do not know why the PET figure jumped so far in a year. Our export tonnes are not a recovery rate.
What this means for you
For households, empty and rinse the bottle, check whether your council wants the lid on or off and squash it only if your council says so. If a container deposit scheme operates where you live, a refund point puts the bottle on the cleanest route to a recycler. For a business or collector with volume, the 2021 and 2022 bans mean that baled mixed plastic has no export route and that single-resin, processed material is what moves. Ask a buyer which resin they are paying for, what contamination they allow, whether the bales are washed or unwashed and who bears the cost if a load is rejected. Our guides on where cardboard and paper go and where an old car goes follow other materials through the same loop. Baled or flaked plastic is the sort of lot a trader might bid on, but we could not confirm that ScrapTrade accepts it, so ask cs@scraptrade.com.au before you plan around it.
What we could not verify
- Why exports fell. The timing fits the 2021 and 2022 bans, and the records also show a rebound in 2023 and 2025-26 that we cannot explain.
- The text of the rules. We relied on a customs notice and trade summaries, and we have not read the rules.
- Where the plastic went. Domestic reprocessing, landfill, stockpiling and finished-product exports are not in our records.
- The PET recovery rate. Sources give about 30 to 37 percent for 2022-23, and we could not check the original report.
- Whether the second Pact and Cleanaway plant opened.
- Australian outlets for recycled HDPE and polypropylene.
- Provisional data. The 2025-26 export figures are provisional, and declared values are border declarations and not prices.
Frequently asked questions
Should plastic bottle lids be on or off?
It depends on your council. Some say on after squashing the air out, some say off, and some say small lids belong in general waste. Check your council or the Recycle Mate app.
Does Australia still export plastic waste?
Yes, but far less. About 15,000 tonnes were exported in 2025-26, against 186,739 tonnes in 2018-19, and most of it was not bottle plastic.
Can a plastic bottle become a new bottle?
Yes, if it is PET and the plant makes food-grade recycled resin. The Albury plant is rated at more than 20,000 tonnes a year.
What do the numbers on bottles mean?
They identify the resin: 1 is PET and 2 is HDPE. They do not say whether your council accepts the bottle.
How much plastic is recycled in Australia?
For 2022-23, sources put plastic packaging recovery at about 26 percent and PET at about 30 to 37 percent. The measures differ.
Sources
- Department of Climate Change, Energy, the Environment and Water, Waste exports data collation, September 2026 (ABS records), ScrapTrade calculations, customs lines 391510, 391520, 391530 and 391590. The 2025-26 figures are provisional.
- Australian Border Force Customs Notice 2021/25 on the plastic export bans; Waste Management Review, Cleanaway and consultancy summaries of the 2021 and 2022 stages, as summarised in search results.
- Circular Plastics Australia coverage: Clean Energy Finance Corporation media release and case study (March 2022), Cleanaway and Pact Group announcements, and trade-press descriptions of the process, as summarised in search results.
- Blue Environment, Plastics Flows and Fates 2022-23, as shown in CSIRO workshop slides; Recycling International coverage of the same report; APCO rigid plastics material factsheet and 2022-23 data release.
- Return and Earn (NSW) and Containers for Change redemption figures, as summarised in search results.
- Council pages (Maroondah, Murray River, Kalamunda, ACT) and press coverage on bottle lids, as summarised in search results.
- Resin code and end-use descriptions from North American recycling guides and an archived US EPA page, as summarised in search results.
This is general information, not financial or legal advice. Process steps are simplified, and sorters, reprocessors and councils differ. Declared export values are border declarations, not prices. ScrapTrade operates a scrap marketplace and has a commercial interest in the scrap trade.