


Australian scrap exporters do not ship at an even pace through the year. Across eight full calendar years of customs data, one month stands out: January. In every year from 2018 to 2025, January metal scrap exports ran below that year's monthly average, usually by a third or more. This article sets out the pattern, shows where it holds and where it does not, and is plain about what the data cannot tell us. It is general information, not trading advice.
What we measured
We used the Department of Climate Change, Energy, the Environment and Water (DCCEEW) collation of Australian Bureau of Statistics (ABS) waste export records [1]. We kept the "Metals" material group, excluded precious-metal scrap (HS 7112) and removed one record we treat as an error, a 92,400 tonne aluminium-scrap line for March 2025 [1]. We used only full calendar years, 2018 to 2025, so that every month is represented equally. For each year we divided each month's tonnes by that year's monthly average, then took the median across the eight years. A figure of 100 means an average month. We have not verified whether the ABS month is the month of shipment or the month the record was processed, so "month" here means the month in the dataset.
The pattern
| Month | Index (100 = average month) |
|---|---|
| January | 66 |
| February | 84 |
| March | 116 |
| April | 97 |
| May | 106 |
| June | 109 |
| July | 103 |
| August | 97 |
| September | 97 |
| October | 110 |
| November | 92 |
| December | 122 |
Source: DCCEEW collation of ABS waste export records, ScrapTrade calculations. Metals excluding precious-metal scrap (HS 7112), 2018 to 2025.
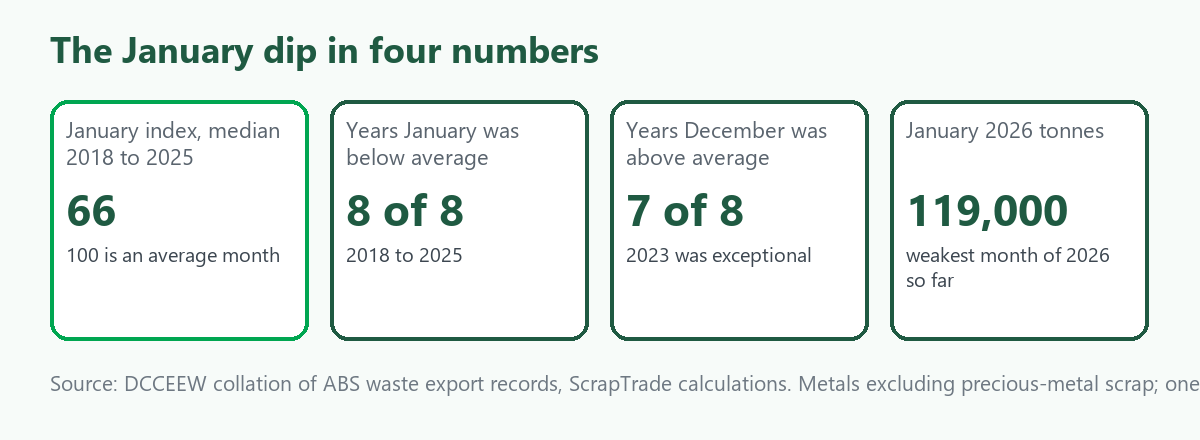
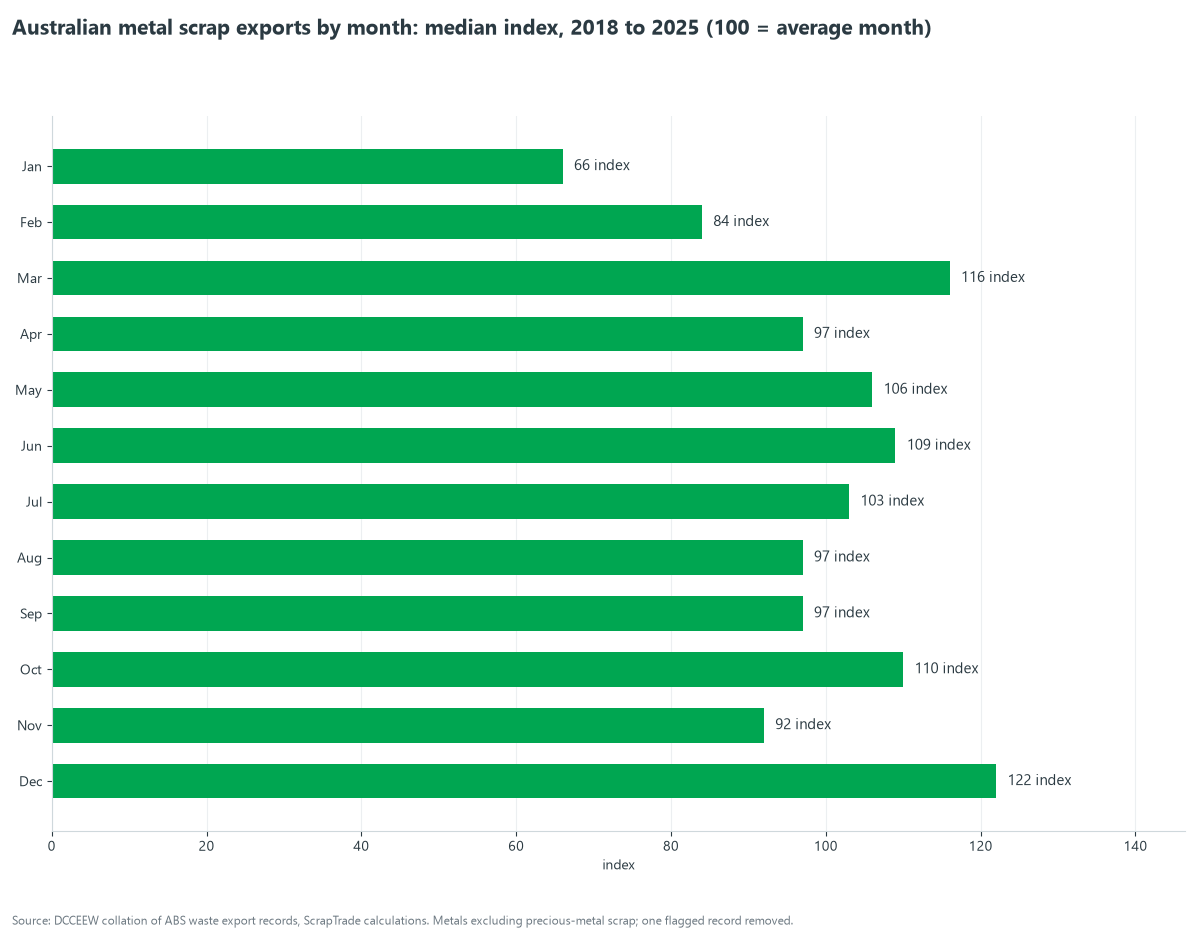
- January is the one reliable feature. It was below the year's average in all eight years, ranging from 45 to 85 on the same index. In an average year January carries about 145,000 tonnes against a monthly average of about 218,000 tonnes.
- February is also soft, at 84, but less consistently.
- March and December lead. March was above average in six of the eight years and December in seven. One December, 2023, was exceptional: about 448,000 tonnes, with India alone taking about 190,000 tonnes. We do not know why, and because we used medians it does not drive the index.
- The rest of the year is noisy. From April to November the monthly figures stay within roughly 10% of average in the median and swing much more in individual years, so we would not build a plan on them.
The same shape appears in value (January 67, March 113, December 116), so this is a volume effect rather than a price effect. And 2026 is following it: January 2026 was about 119,000 tonnes, the lowest month so far this year, followed by 212,000 in February and 298,000 in March.
By metal
| Metal | January | March | December |
|---|---|---|---|
| Ferrous scrap (HS 7204) | 62 | 116 | 124 |
| Aluminium scrap (HS 7602) | 76 | 110 | 111 |
| Copper scrap (HS 7404) | 74 | 106 | 111 |
Source: as above. Median monthly index, 2018 to 2025.
Ferrous scrap, which makes up most of the tonnage, drives the headline number. The January dip is shallower for aluminium and copper, but it is there in both.
By destination
If the dip came from one buyer's holiday, it would show in one country's numbers. It does not. Using the same method for the ten largest destinations, January was below the average month for every one of them. For the four largest it was 59 for Bangladesh, 66 for India, 46 for Indonesia and 55 for Vietnam. Pakistan (47) and China (60) were also well below, and Malaysia (90) was the mildest. See Bangladesh vs Indonesia vs Vietnam: Australian Scrap Buyers for who these buyers are.
Some destinations show their own patterns on top of this. Bangladesh and India both ran high in May (index 142 and 140) and low in November (55 and 73), and Indonesia was weakest in January and strongest in November (146). We have no source that explains these, so we report them as observations only.
What might explain it, and what we can say
The data shows the pattern. It does not show the cause. Here is what the trade press says and where it falls short.
- Chinese holiday timing. Shanghai Metals Market reported on 23 January 2025 that most aluminium scrap suppliers had entered holiday mode ahead of the Chinese New Year and that transactions were weakening [2]. SteelOrbis described Chinese domestic scrap demand at the end of December 2025 as slack during the traditional cold winter offseason for finished steel, with the New Year holiday approaching [3]. These are reports about China's domestic market. They support a seasonal slowdown in Chinese demand, but China took only a small share of Australian scrap in this data, and the dip shows in Bangladesh, India and Indonesia too.
- Australia's own summer. It is plausible that yards, hauliers and shipping lines have thinner schedules over late December and January in Australia, which could affect shipments leaving in January. We found no source on this, so it is a hypothesis.
- Year-end loading. The December peak could reflect cargoes being loaded before holiday closures. That is also a hypothesis.
We cannot rank these causes from customs data alone. If you are planning around the pattern, the plan does not depend on the cause, because the pattern has repeated for eight years.
A scenario: reading a weak January
Anil runs a yard in Adelaide (invented). In late January he notices that the freight forwarder has fewer sailing options and his buyer's enquiries are quiet. In February, a trader tells him the market has "fallen away". He checks the pattern instead.
- He compares January with last January, not with December. The seasonal dip is built in, so a month-on-month fall tells him little.
- He looks at price separately. Tonnes are low in January, but that alone does not mean prices are. See How Scrap Prices Are Set.
- He books freight and loads dates early, because the weak months are followed by a busy March.
- He avoids forcing a sale in the quiet month if his storage and cash flow let him wait.
What this means for you
- Read monthly export figures against the same month a year earlier. A single month's drop is often seasonal.
- Expect a thin January and February, and plan stock, cash and bookings around it.
- Expect a busy March and December, and book containers or vessel space early.
- Do not assume a low month means low prices. The data shows volumes. Prices are a separate question.
- Treat the April to November months as noise. They do not repeat reliably.
For the longer trend, see Australian Scrap Exports: Seven Years of Change, and for where scrap leaves from, Australia's Scrap Export Ports. You can compare buyers on the marketplace or register.
What we could not confirm
- Whether the dataset's month is the shipment month. We did not verify how the ABS assigns it.
- The cause of the January dip. The sources we found describe Chinese market seasonality, not Australian shipping.
- Why December 2023 was so large, or why Bangladesh and India peak in May.
- Whether the pattern will continue. Eight years is a short run, and one outlier year can shift a median.
- Other metals. Smaller categories such as zinc and nickel scrap are too small and irregular in this data to analyse by month.
Frequently asked questions
Which month are Australian scrap exports lowest?
January. It was below the yearly monthly average in all eight years from 2018 to 2025, with a median of 66 on an index where 100 is an average month [1].
Which months are highest?
December and March had the highest median indices, 122 and 116 [1].
Is the January dip because of the Chinese New Year?
Not on this evidence alone. The Chinese holiday affects Chinese demand [2][3], but Australian exports to Bangladesh, India, Indonesia and Vietnam also dip in January, and the data cannot tell us the cause.
Does the dip affect prices?
Volumes dip in January. This data does not show prices, so we cannot say whether prices follow.
Does the pattern apply to every metal?
It applies to ferrous, aluminium and copper scrap, though the dip is shallower for the non-ferrous metals [1].
Sources
- Department of Climate Change, Energy, the Environment and Water, Waste exports data collation, September 2026 (ABS records), ScrapTrade calculations. 2026 figures are provisional.
- Shanghai Metals Market, Aluminum Scrap Suppliers Mostly on Holiday, Market Transactions Weaken (23 January 2025).
- SteelOrbis, Chinese local scrap indicates minimal changes, demand unlikely to improve soon (31 December 2025).
Figures are ScrapTrade calculations from customs records and are not forecasts. The scenario is invented. This article is general information, not trading advice. ScrapTrade operates a scrap marketplace and has a commercial interest in the scrap trade.