

Most commentary on Australian scrap exports asks where the metal goes: Bangladesh, Indonesia, Vietnam, India. A different question matters to anyone planning a sale or a shipment: where does it leave from? The port of loading shapes the haulage a seller pays, the ships a buyer can send and, as the data shows, even the kind of metal that moves. This article uses the Department of Climate Change, Energy, the Environment and Water (DCCEEW) collation of Australian Bureau of Statistics (ABS) waste export records to map where Australian metal scrap leaves, port by port, for the 2025-26 financial year. The 2025-26 figures are provisional. It is general information, not shipping or trading advice.
The short version
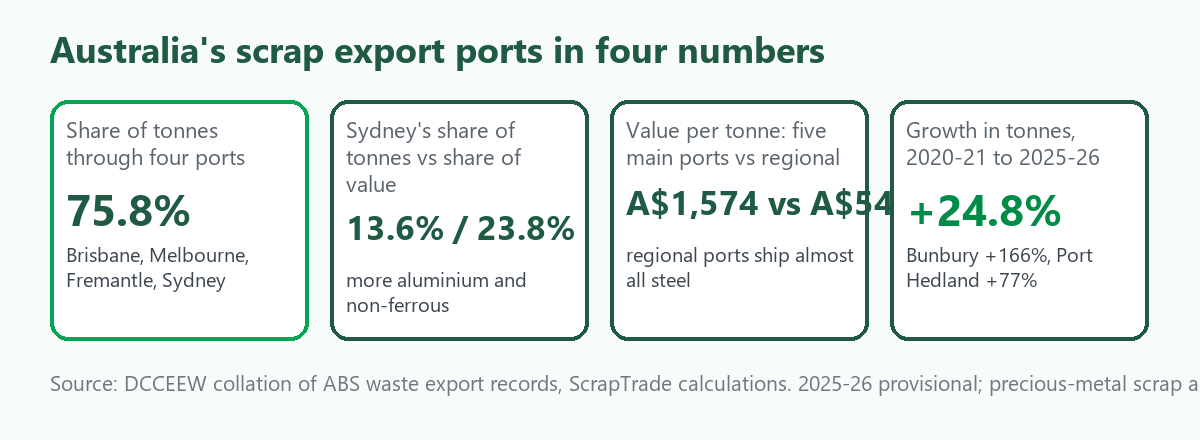
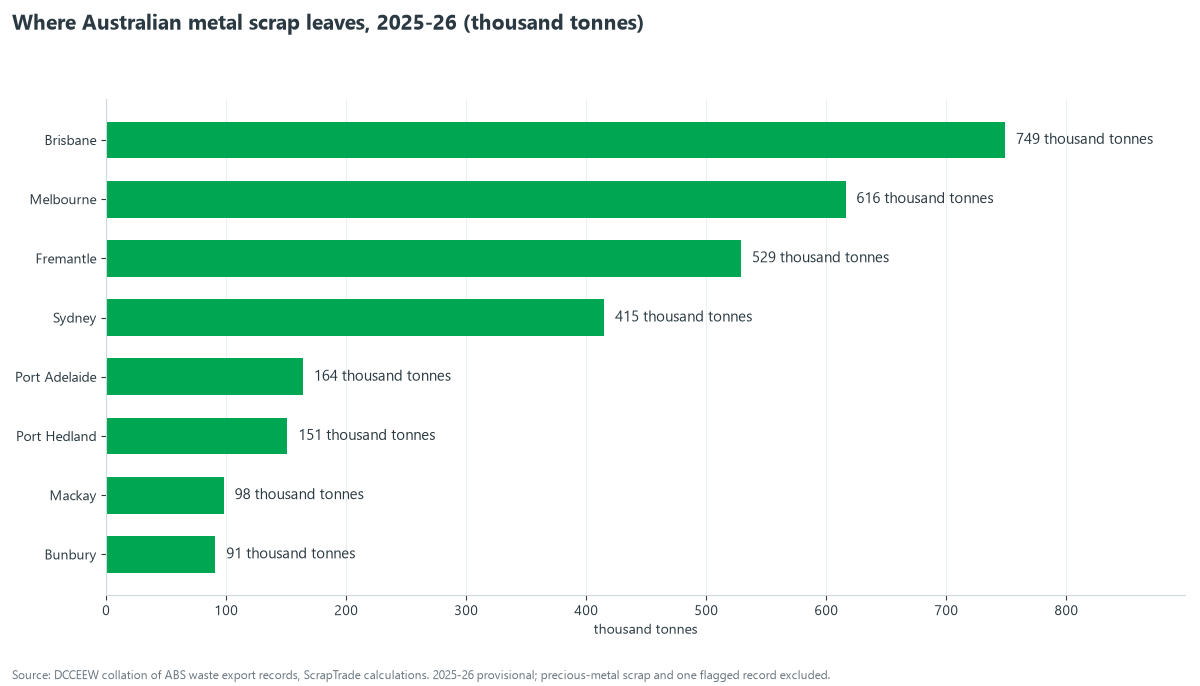
Four ports handled 75.8% of the tonnes in 2025-26: Brisbane, Melbourne, Fremantle and Sydney. Add Port Adelaide and the figure is 81.2%. The remaining 18% of tonnes leaves through a long tail of resource and regional ports that ship almost nothing but steel. These are customs-based export records, so they show where cargo was loaded, not where the metal was collected.
| Port | Tonnes, 2025-26 | Share of tonnes | Share of value | Average A$ per tonne | Steel share of tonnes |
|---|---|---|---|---|---|
| Brisbane | 748,582 | 24.6% | 23.0% | 1,290 | 83% |
| Melbourne | 616,190 | 20.2% | 24.1% | 1,646 | 77% |
| Fremantle | 529,211 | 17.4% | 14.5% | 1,153 | 89% |
| Sydney | 414,517 | 13.6% | 23.8% | 2,417 | 68% |
| Port Adelaide | 163,893 | 5.4% | 7.1% | 1,820 | 77% |
| Port Hedland | 150,747 | 5.0% | 2.0% | 569 | 100% |
| Mackay | 97,941 | 3.2% | 1.0% | 417 | 100% |
| Bunbury | 90,684 | 3.0% | 1.0% | 486 | 100% |
Source: DCCEEW collation of ABS waste export records, ScrapTrade calculations. "Metals" group, 2025-26 provisional. Value is customs value, not a price.
Two things were removed before calculating, for reasons explained at the end: one outlier record and the small category of precious-metal scrap.
Why Sydney looks different
Sydney shipped 13.6% of the tonnes but 23.8% of the value, an average of A$2,417 a tonne against A$1,290 at Brisbane and A$1,153 at Fremantle. The reason is the metal mix, not the price of steel. Steel was 68% of Sydney's tonnes, but only 20% of its value. Aluminium made up 23% of the tonnes and 36.5% of the value, and non-ferrous metals other than aluminium 8% of the tonnes and 43.5% of the value. Nationally, copper makes up almost all of that group: about 113,000 of its 118,000 tonnes in 2025-26.
| Port | Steel share of value | Aluminium share of value | Other non-ferrous share of value |
|---|---|---|---|
| Sydney | 20.0% | 36.5% | 43.5% |
| Melbourne | 27.7% | 40.9% | 31.4% |
| Port Adelaide | 28.3% | 38.1% | 33.6% |
| Brisbane | 35.6% | 40.8% | 23.6% |
| Fremantle | 50.5% | 22.5% | 27.0% |
Sydney also handled the largest share of non-ferrous scrap other than aluminium, 29.5% of that national volume, ahead of Melbourne with 25.6%. For aluminium the three eastern ports are close: Melbourne 29.5%, Brisbane 27.2% and Sydney 25.6% of national tonnes. For more on those two metals, see Who Buys Australia's Aluminium and Copper Scrap.
Steel ports and resource ports
Brisbane is the largest port by tonnes because it is the largest steel port: 24.4% of the national iron and steel tonnes left through it, ahead of Melbourne and Fremantle at 18.6% each and Sydney at 11.1%. Fremantle is the most steel-dependent of the main ports, with 89% of its tonnes in iron and steel.
The regional and resource ports are almost purely ferrous. Port Hedland, Mackay, Bunbury, Dampier, the Northern Territory ports, Gladstone, Townsville, Darwin and Cairns together shipped 18.1% of the tonnes at an average of A$544 a tonne, against A$1,574 for the five main ports. Again, this is mostly a matter of what they ship. The prices behind it are in our ferrous buyer comparison.
Who each port ships to
The same buyer countries appear at every port, but in different proportions. These are shares of each port's tonnes in 2025-26.
| Port | Main destinations |
|---|---|
| Brisbane | Bangladesh 29%, Indonesia 26%, Thailand 11%, India 9%, Malaysia 6% |
| Melbourne | India 24%, Bangladesh 23%, Indonesia 15%, Thailand 11%, China 9% |
| Fremantle | Bangladesh 28%, Vietnam 18%, Indonesia 15%, India 12%, Thailand 7% |
| Sydney | Indonesia 24%, India 20%, Thailand 14%, Taiwan 11%, China 8% |
| Port Adelaide | Indonesia 25%, Bangladesh 23%, Vietnam 15%, India 12%, China 7% |
| Port Hedland | Vietnam 50%, Bangladesh 42%, India 7% |
A few patterns stand out. Melbourne is the main route to India. Fremantle has Vietnam as a strong second buyer. Port Hedland has only three destinations of any size, and half its tonnes go to Vietnam. Sydney is the only one of the five where Taiwan reaches double digits.
The reason is not stated in the data. A reasonable guess is that buyers' shipping routes and the mix of metal at each port both play a part. That is our inference, not a finding.
Most scrap leaves from its home state
In each of the five main ports, about nine tonnes in ten came from the same state. Roughly 91% of Brisbane's tonnes were of Queensland origin, 93% of Melbourne's of Victorian origin, 93% of Fremantle's of Western Australian origin, 89% of Sydney's of New South Wales origin and about 94% of Port Adelaide's of South Australian origin. For a seller this means that the nearest capital-city port is the normal route, and that cross-state moves are the exception.
The exception that stands out is Port Hedland, where 22% of the 2025-26 tonnes (32,962) are recorded as of New South Wales origin, with the rest from Western Australia. We do not know why scrap recorded as originating in New South Wales leaves from Port Hedland, and the data does not say. It could reflect how a trader recorded the origin or how a cargo was assembled. We flag it as unexplained.
What changed since 2020-21
Port-of-loading records are only complete from 2020-21 in this dataset, so that is the starting point. Over those five years the tonnes shipped rose 24.8% and the value 86.7%. By port:
| Port | Tonnes 2020-21 | Tonnes 2025-26 | Change |
|---|---|---|---|
| Brisbane | 567,700 | 748,600 | +32% |
| Fremantle | 408,700 | 529,200 | +30% |
| Melbourne | 517,700 | 616,200 | +19% |
| Port Adelaide | 141,700 | 163,900 | +16% |
| Sydney | 373,300 | 414,500 | +11% |
| Port Hedland | 85,200 | 150,700 | +77% |
| Mackay | 52,700 | 97,900 | +86% |
| Bunbury | 34,100 | 90,700 | +166% |
| Gladstone | 73,600 | 41,600 | -43.5% |
| Townsville | 51,900 | 36,300 | -30% |
The four largest ports' share of tonnes barely moved, from 76.6% in 2020-21 to 75.8%, so the concentration is stable. The shift is within the tail: some regional ports, especially in Western Australia and central Queensland, have grown fast from a small base, while Gladstone and Townsville have shrunk. Port Hedland also shows how lumpy a bulk port can be. Its 2025-26 shipments were concentrated in a few months, with about 32,000 t in February and 30,000 t in December, but only 111 t in August and none at all in some months.
What this means for sellers
- Your nearest main port decides who you can reach easily. If you are in Victoria, the data shows a strong India and Bangladesh link. In Western Australia it is Bangladesh and Vietnam. Check with an exporter or broker which buyers they actually supply from your nearest port.
- Non-ferrous sellers should look at the east coast. Melbourne, Brisbane and Sydney together took about 82% of aluminium tonnes and 75% of other non-ferrous tonnes, while Fremantle took 10% and 16%.
- Do not read the A$ per tonne as a price. It is a customs value across a mixed basket. A port with a rich non-ferrous mix will always look "dearer" than a steel port.
- Check who pays for what at the port. The shipping term in your contract decides whether the buyer or you pays for the leg to the vessel. See Incoterms in Scrap Deals: FOB, CFR and CIF and Australia's Waste Export Rules and Scrap Metal.
- Use the national picture for context. The wider trend is in our nine-year trend analysis and the overall dataset in our 2025-26 export data analysis.
You can compare buyers on the marketplace or register.
Method, exclusions and limits
- Data. DCCEEW's collation of ABS waste export records, "Metals" group (iron and steel, aluminium and non-ferrous metals other than aluminium), 2020-21 to 2025-26. The 2025-26 year is provisional.
- Excluded record. One March 2025 aluminium record (92,400 tonnes valued at A$253,796, Townsville to Korea, in 2024-25) is excluded from all our analyses because the value per tonne is implausible. It does not affect the 2025-26 figures, but we left it out of the 2020-21 comparison base for consistency.
- Precious-metal scrap excluded. Customs lines for scrap and waste of precious metals (HS 7112) are in the metals group but behave very differently: 2,238 tonnes worth A$371 million in 2025-26, an average of about A$166,000 a tonne. Left in, they would add A$122.8 million to Sydney's value (11% of its total) and A$98.7 million to Townsville's, from only 41 tonnes. We removed them so that a few hundred tonnes of precious-metal scrap does not distort port comparisons. Those exports are real and are a separate story.
- Hazardous lines. The metals group in our analyses does not include the hazardous copper-bearing slag and residue line discussed in our seven-year trend article.
- Port of loading is not the origin of collection. Records show where cargo was loaded. Inland scrap travelled to get there, and the data has no information on rail, trucking or container versus bulk.
- Confidential ports. Some ports are grouped as "confidential" in the source data, such as the Northern Territory ports line, and a handful of ports appear in the data with very small volumes.
- Value is a customs value, not a market price, and it depends on the metal mix.
Frequently asked questions
Which port exports the most scrap metal in Australia?
Brisbane, with about 749,000 tonnes in 2025-26, or 24.6% of the national total. Melbourne is second with 616,000 tonnes [1].
Which port has the highest-value scrap exports?
Sydney, with about A$1.0 billion, 23.8% of the national value on only 13.6% of the tonnes. Its mix is richer in aluminium and copper [1].
Where does Western Australian scrap go?
Fremantle's main destinations are Bangladesh (28%), Vietnam (18%), Indonesia (15%) and India (12%). Port Hedland ships half its tonnes to Vietnam and 42% to Bangladesh [1].
Do small regional ports matter?
Together they handled 18% of national tonnes in 2025-26, almost entirely steel, and some are growing fast, such as Bunbury and Mackay [1].
Is the port a good guide to price?
No. The average value per tonne reflects the metal mix at each port. A port with more copper and aluminium will look more valuable than one that ships steel [1].
Sources
- Department of Climate Change, Energy, the Environment and Water, Waste exports data collation, September 2026 (ABS records), ScrapTrade calculations. The 2025-26 figures are provisional.
Figures are ScrapTrade calculations from the source above and may be revised when the data is. Value is a customs value, not a market price. This article is general information, not shipping, legal or trading advice. ScrapTrade operates a scrap marketplace and has a commercial interest in the scrap trade.