

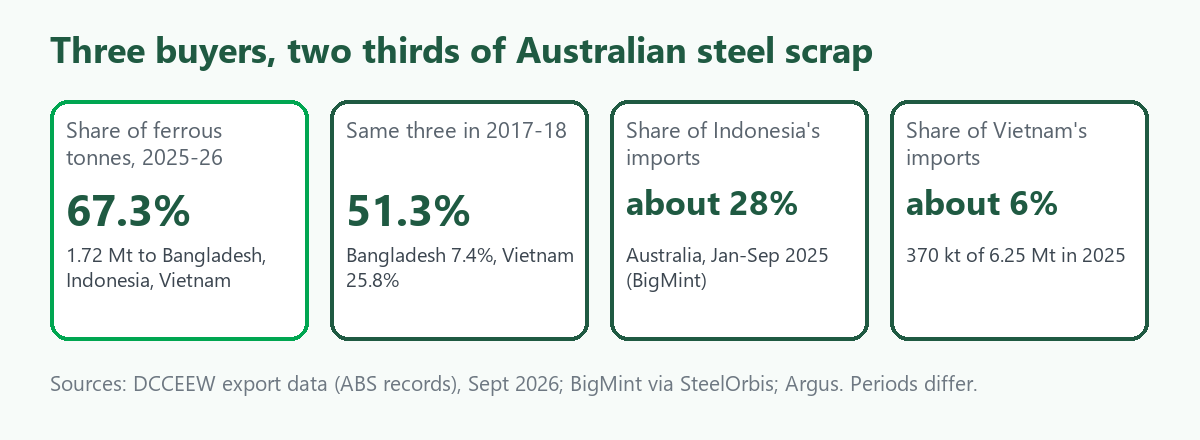
Updated 28 October 2026. Three countries now take two out of every three tonnes of steel scrap Australia exports. In 2025-26 Bangladesh, Indonesia and Vietnam together received 1.72 million tonnes of the 2.55 million tonnes sold, or 67.3%, worth about A$868 million. Nine years ago the same three took 51.3%. We have written a profile of each, Bangladesh, Indonesia and Vietnam. This article puts them side by side and asks questions the single profiles do not: who sells to which buyer, what grade each one takes, how steady each buyer is and, most useful for a seller, how much each depends on Australia compared with how much we depend on them. It is general information, not trading advice.
The source is the Department of Climate Change, Energy, the Environment and Water's collation of Australian Bureau of Statistics export records (September 2026), which covers financial years from 2017-18 to 2025-26, with the latest year provisional. "Ferrous scrap" here means the iron and steel waste categories in those records. Export values are declared at the border for mixed shipments, so they are not what a yard is paid.
The snapshot
| 2025-26 | Bangladesh | Indonesia | Vietnam |
|---|---|---|---|
| Tonnes | 805,449 | 505,919 | 404,146 |
| Share of Australian ferrous scrap | 31.6% | 19.9% | 15.9% |
| Declared value | A$387 million | A$257 million | A$224 million |
| Average A$ per tonne | 481 | 508 | 554 |
| Share in 2017-18 | 7.4% | 18.1% | 25.8% |
Look at the last row. Vietnam used to be the biggest of the three, and is now the smallest. Bangladesh went the other way.
Nine years of ups and downs
| Thousand tonnes | 17-18 | 18-19 | 19-20 | 20-21 | 21-22 | 22-23 | 23-24 | 24-25 | 25-26 |
|---|---|---|---|---|---|---|---|---|---|
| Bangladesh | 151 | 294 | 608 | 361 | 398 | 475 | 871 | 658 | 805 |
| Indonesia | 367 | 484 | 294 | 305 | 350 | 293 | 187 | 335 | 506 |
| Vietnam | 522 | 649 | 342 | 458 | 477 | 201 | 320 | 386 | 404 |
| Average A$ per tonne | 17-18 | 18-19 | 19-20 | 20-21 | 21-22 | 22-23 | 23-24 | 24-25 | 25-26 |
|---|---|---|---|---|---|---|---|---|---|
| Bangladesh | 533 | 495 | 439 | 437 | 739 | 682 | 681 | 561 | 481 |
| Indonesia | 461 | 491 | 447 | 476 | 653 | 617 | 624 | 578 | 508 |
| Vietnam | 475 | 577 | 474 | 542 | 682 | 623 | 783 | 696 | 554 |
Source for all tables in this article unless stated: DCCEEW export data collation, ScrapTrade calculations.
Three things stand out.
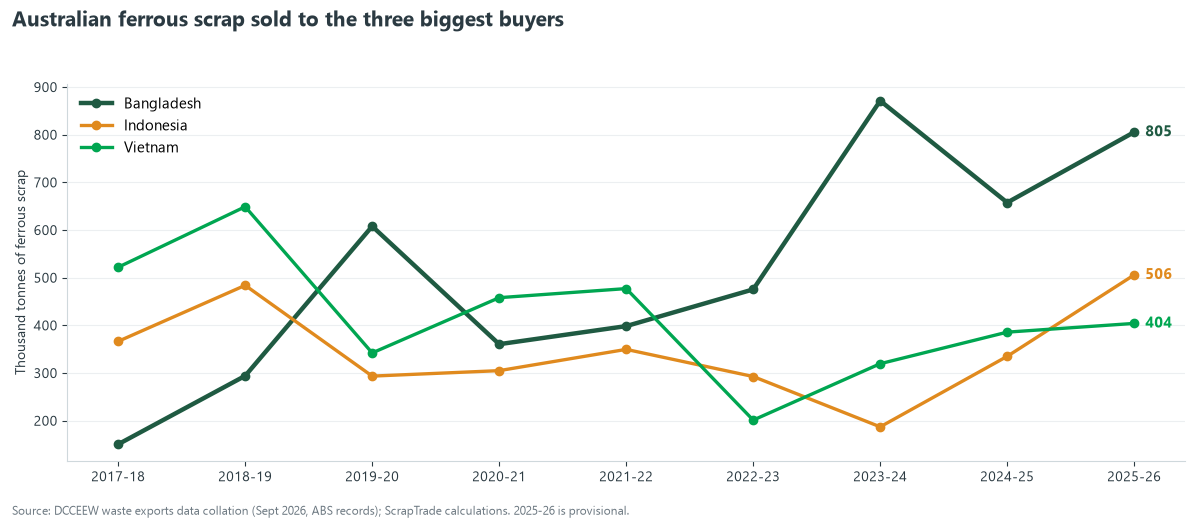
Bangladesh swings the most. Over nine years it averaged about 513,000 tonnes a year, ranging from 151,000 to 871,000. Indonesia averaged 347,000 tonnes (187,000 to 506,000) and Vietnam 418,000 (201,000 to 649,000). Measured against its own average, Bangladesh's year-to-year movement was about 50% larger than the other two, so it has been the least predictable buyer even while becoming the biggest.
Indonesia is at its highest level in the nine years of data, 506,000 tonnes, up 51% in a year. That can be good news for the market, but it also means a year above its average. Vietnam, by contrast, is slightly below its nine-year average.
Prices peaked in 2021-22 or 2023-24 and have fallen since. From their highs, the declared average fell about 35% for Bangladesh (A$739 to A$481), 22% for Indonesia and 29% for Vietnam (A$783 to A$554). Part of this is the global scrap price cycle, and part may be a change in what is shipped. The records do not separate the two.
Where the scrap comes from
| Share of each buyer's tonnes, 2025-26 | Bangladesh | Indonesia | Vietnam |
|---|---|---|---|
| Western Australia | 31.6% | 17.4% | 58.0% |
| Queensland | 37.0% | 34.9% | 19.9% |
| Victoria | 18.7% | 18.5% | 2.1% |
| New South Wales | 7.3% | 19.5% | 1.1% |
| South Australia | 4.6% | 8.0% | 7.2% |
| Northern Territory | 0.4% | none | 11.5% |
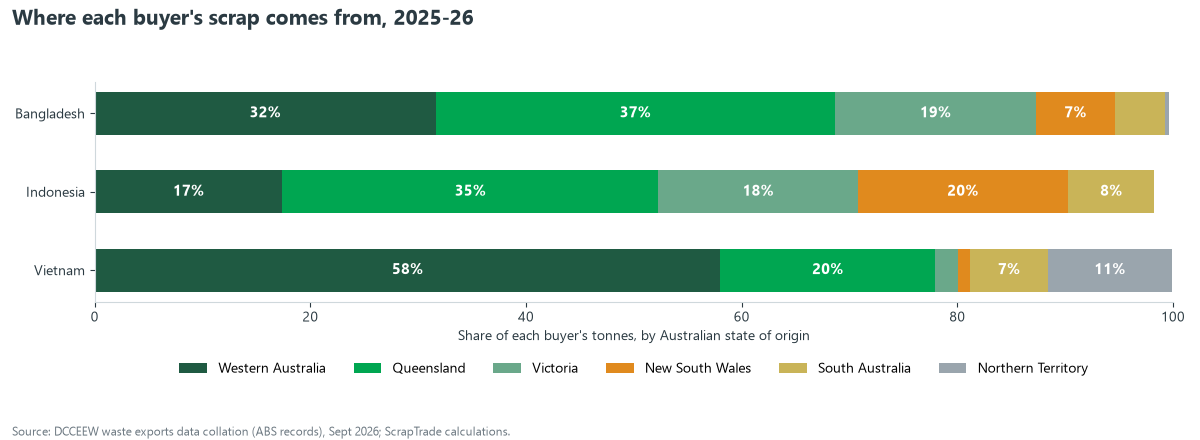
The picture is different for each buyer.
- Vietnam is largely a Western Australian customer. 58% of its tonnes came from WA, and another 11.5% from the Northern Territory. Almost no scrap from Victoria or New South Wales went to Vietnam.
- Bangladesh draws from the east and the west. Queensland is its biggest source at 37%, followed by Western Australia at 32% and Victoria at 19%.
- Indonesia is the most evenly spread, with four of the five main exporting states each supplying 17% or more. It is also the main customer for New South Wales material: 20% of Indonesia's tonnes came from there, against 7% for Bangladesh and 1% for Vietnam.
Flip the table around and the dependence is stark. Of all the ferrous scrap leaving Western Australia in 2025-26, 77% went to these three buyers. For Queensland it was 75%, for South Australia 82%, for the Northern Territory 91%, for Victoria 51% and for New South Wales 45%.
The ports tell the same story. Brisbane loaded 219,000 tonnes for Bangladesh and 192,000 for Indonesia but only 25,000 for Vietnam. Fremantle served all three. Port Hedland loaded 76,000 tonnes for Vietnam and 63,000 for Bangladesh. Sydney was mainly an Indonesia port, at 95,000 tonnes, against 23,000 for Bangladesh. The data do not show why, but freight distance and where the mills and ports are plausible reasons.
What each buyer takes
Australian export records split ferrous scrap into a few categories. The main one covers ordinary steel scrap, which can include shredded and heavy melting grades, but the records do not break it down further. Cast iron, turnings and remelting ingots have their own codes.
| Share of each buyer's tonnes, 2025-26 | Bangladesh | Indonesia | Vietnam |
|---|---|---|---|
| Main steel scrap code | 57.7% | 75.8% | 69.0% |
| Cast iron | 23.4% | 5.3% | 24.5% |
| Scrap and remelting ingots | 15.5% | 18.3% | 5.5% |
| Turnings and shavings | 2.9% | 0.1% | 0.9% |
| Average A$ per tonne, 2025-26 | Bangladesh | Indonesia | Vietnam |
|---|---|---|---|
| Main steel scrap code | 498 | 484 | 609 |
| Cast iron | 453 | 457 | 422 |
| Scrap and remelting ingots | 484 | 617 | 472 |
Two points.
First, cast iron goes mostly to Bangladesh and Vietnam. Together they took about 287,000 tonnes of it, against 27,000 for Indonesia. If you sell cast iron, those are your two markets.
Second, Vietnam paid about A$609 a tonne on average in the main code, 22% above Bangladesh's A$498 and 26% above Indonesia's A$484. That is a big gap. We cannot say whether it reflects higher-grade material, a different mix inside the code, the timing of cargoes or other factors. It matches the pattern in trade press, where Vietnam is a price-sensitive market that buys from several suppliers [1], but it should be read as a question to ask rather than an answer.
How steadily they buy
Annual totals hide how the tonnes arrive month by month. In 2025-26:
| Month by month, thousand tonnes | Lowest month | Highest month |
|---|---|---|
| Bangladesh | 13 (January 2026) | 98 (March 2026) |
| Indonesia | 19 (July 2025) | 80 (October 2025) |
| Vietnam | 2 (September 2025) | 73 (June 2026) |
Vietnam's monthly volume was the most uneven. Its two lowest months, September 2025 and February 2026, were 2,000 and 3,000 tonnes, and then it took 73,000 tonnes in June 2026. That fits a market where mills buy in large cargoes. S&P Global's Platts, which on 12 October 2026 proposed a new daily scrap price assessment for Vietnam starting 1 December, bases it on cargoes of 5,000 tonnes and above, with shipment 30 to 60 days ahead [2]. If you sell to Vietnam, expect to deal in bulk shipments with gaps between them, not a steady flow.
Who needs whom
The three buyers are very different in how much they rely on Australia, and that is the most useful thing for a seller to understand.
| Australian sales | Buyer's total imports | Australia's share | |
|---|---|---|---|
| Indonesia | 230,000 t in January to September 2025, per BigMint | 820,000 t in the same period | about 28% |
| Bangladesh | about 170,000 t in January to April 2026, per BigMint | 1.02 million t of bulk imports in the period | roughly one in six |
| Vietnam | 369,525 t in 2025 | 6.25 million t | about 6% |
The Indonesia figures are from BigMint's report of Indonesian customs data, which also put Hong Kong first at 240,000 tonnes and Australia second at 230,000 [3]. The Bangladesh figure is from BigMint's report that Australian-origin imports rose about 13% to roughly 170,000 tonnes in the first four months of 2026, against 1.02 million tonnes of bulk imports in the same period [4]. The report does not say whether the 170,000 is bulk only, so treat the ratio as rough. The Vietnam figures are Argus's and SteelOrbis's reading of Vietnamese customs data [1][5]. The periods differ from our financial years, and the sources count shipments in different ways.
Even allowing for that, the contrast is clear.
- Indonesia leans on Australia. About 28% of its imports came from us, and for Australia it is the second-biggest buyer. Each side matters to the other.
- Bangladesh is big for us and moderately reliant on us. It takes almost a third of our tonnes, and we are one of several suppliers, alongside Japan, which BigMint named as its biggest in early 2026 [4].
- Vietnam barely notices us. Japan supplied 52.7% of its imports in 2025 while Australia supplied around 6% [1][5]. It matters to Australian sellers in Western Australia, but Vietnamese mills can switch away from Australian cargoes without great difficulty.
That last point is important. A buyer that depends on you gives you more bargaining power. A buyer that does not can walk away. Indonesia's dependence on Australia is a quiet advantage that Australian sellers rarely hear about.
The risks, by buyer
- Bangladesh. The biggest swings, and prices are lower than a few years ago. SteelOrbis described the market in early October 2026 as very quiet, despite a slight rise in offers [6]. Bangladesh is also among the countries the European Commission's draft list would not authorise to receive EU metal scrap from 2027, though that list is not adopted. See Europe Is Keeping Its Scrap. Who Pays?.
- Indonesia. The rules have changed several times since 2019, and the sources we could verify are not recent. Confirm with your buyer what import approval and inspection apply before you ship. Its volume is at a nine-year high, so do not assume it stays there.
- Vietnam. Lumpy buying and tough competition from Japan. SMM reported in June 2026 that Australian offers were around US$380 to 385 a tonne CFR Vietnam, against about US$370 for Japanese H2 scrap [7]. Those are spot quotes that change weekly.
What it means for different sellers
- If you ship from Western Australia, Vietnam and Bangladesh are your natural markets, with Indonesia third. Vietnam suits bulk cargoes.
- If you ship from Queensland, Bangladesh and Indonesia are the big two.
- If you are in New South Wales, Indonesia is by far your largest destination among the three. Check the buyers there first.
- If you are in Victoria, Bangladesh takes about 150,000 tonnes and Indonesia about 93,000, and roughly half of your ferrous scrap goes elsewhere. See Australia's Scrap Metal Exports: 2025-26 Data.
- If you sell cast iron, look first at Bangladesh and Vietnam.
- If you sell small lots, none of this applies directly. These buyers deal in shipments, so your material reaches them through exporters and processors. See How a Scrap Export Deal Works, Step by Step and how to grade scrap metal.
Whatever your state, try to have more than one of these buyers in sight. A buyer that took a third of our scrap can change its mind in a quarter. Compare offers on the marketplace and check indicative prices on the price calculator.
What we cannot tell you
- Whether the price gaps between buyers reflect grade, timing or something else.
- Why Indonesia's volume jumped 51% in one year. We have seen no source that explains it.
- What share of Bangladesh's imports Australia supplies over a full year. The ratio above is from four months.
- What the Indonesian import rules are today. The sources we verified are older.
- How much of what Australia sends to these three is re-exported or traded through hubs.
Frequently asked questions
Who is the biggest buyer of Australian scrap steel?
Bangladesh, with 805,449 tonnes or 31.6% of ferrous scrap in 2025-26, followed by Indonesia (19.9%) and Vietnam (15.9%).
Which of the three pays the most per tonne?
Vietnam, with an average declared value of about A$554 a tonne in 2025-26, against A$508 for Indonesia and A$481 for Bangladesh. These are declared export values, not yard prices.
Which buyer is most dependent on Australia?
Indonesia. BigMint's customs data show Australia supplying about 230,000 of its 820,000 tonnes of imports in January to September 2025, roughly 28% [3].
Which buyer is the least predictable?
Bangladesh. Its yearly tonnes swung more than the others, from 151,000 to 871,000 over nine years. Vietnam's monthly shipments were the most uneven.
Where does Western Australia's scrap go?
Mostly to these three buyers: 77% of its ferrous scrap in 2025-26. Bangladesh took about 255,000 tonnes, Vietnam about 235,000 and Indonesia about 88,000.
Sources
- Argus, Vietnam's ferrous scrap imports rise in 2025 (13 January 2026).
- S&P Global Platts, Platts proposes to launch daily HS CFR Vietnam ferrous scrap price assessment (12 October 2026).
- SteelOrbis, East Asian ferrous scrap imports show mixed trends across key geographies in 9MCY25 (25 November 2025), source BigMint.
- BigMint, Bangladesh bulk ferrous scrap imports rise 11% year on year in January-April 2026.
- SteelOrbis, Vietnamese customs data tables for 2025, as reported, and Vietnam's 2025 total from Argus [1].
- SteelOrbis, Bangladesh's import scrap offers edge up, low steel demand keeps buyers on sidelines (October 2026). Only the opening summary is publicly visible.
- SMM, Vietnam import scrap remains soft as buyers stay cautious (June 2026).
- Department of Climate Change, Energy, the Environment and Water, Waste exports data collation, September 2026 (ABS records), ScrapTrade calculations. The 2025-26 figures are provisional.
Figures are as reported by the sources named. Export values are border declarations for mixed shipments, not yard prices, and the buyer-side periods differ from Australian financial years. This article is general information, not trading advice. ScrapTrade operates a scrap marketplace and has a commercial interest in the scrap trade.