

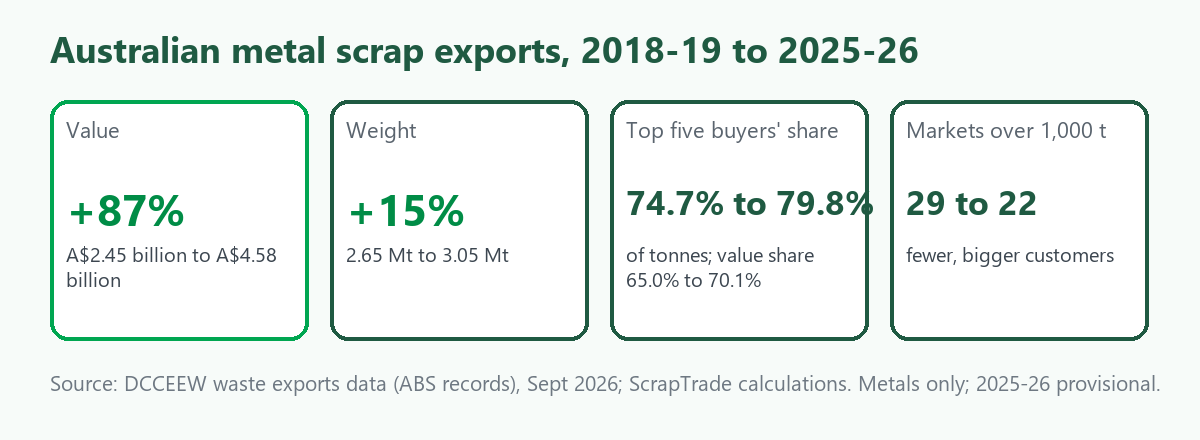
Updated 28 October 2026. In 2018-19, Australia sold overseas about 2.65 million tonnes of metal scrap worth A$2.45 billion. In 2025-26 it sold 3.05 million tonnes worth A$4.58 billion. The weight is up 15%. The value is up 87%. That gap is the whole story of the last seven years: Australia is selling a bit more scrap, to fewer customers, at much higher prices per tonne, and the mix of what it sells has moved from steel towards copper and aluminium. This article uses Australian export records to show which markets grew, which faded and what that means for sellers. It is general information, not trading advice.
The source is the Department of Climate Change, Energy, the Environment and Water's collation of Australian Bureau of Statistics export records, released in September 2026. We cover the "metals" group: iron and steel, aluminium and non-ferrous metals such as copper, brass and lead. Financial years run July to June, the data start in 2017-18 and 2025-26 is provisional. Values are declared at the border for mixed shipments, not what a yard is paid. One recording error in aluminium, a March 2025 entry of 92,400 tonnes worth under A$3 a tonne, is excluded, as explained in Who Buys Australia's Aluminium and Copper Scrap.
What changed in what Australia sells
| 2018-19 | 2025-26 | Change | |
|---|---|---|---|
| Iron and steel tonnes | 2,223,000 | 2,548,000 | +15% |
| value | A$1,199 million | A$1,528 million | +27% |
| value per tonne | A$540 | A$600 | +11% |
| Aluminium tonnes | 296,000 | 378,000 | +28% |
| value | A$655 million | A$1,431 million | +118% |
| value per tonne | A$2,211 | A$3,790 | +71% |
| Non-ferrous excluding aluminium tonnes | 132,000 | 121,000 | -8% |
| value | A$593 million | A$1,620 million | +173% |
| value per tonne | A$4,505 | A$13,422 | +198% |
| All metals tonnes | 2,650,000 | 3,046,000 | +15% |
| value | A$2,448 million | A$4,579 million | +87% |
Source: DCCEEW export data collation, ScrapTrade calculations.
Three points.
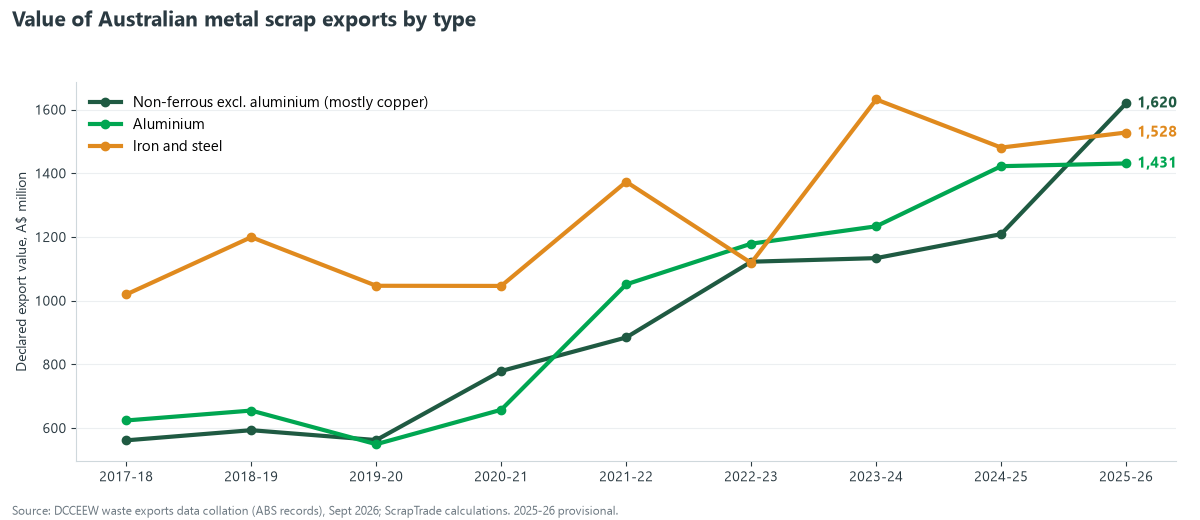
Steel is volume, copper is value. Steel is still 84% of the weight and about a third of the value. Non-ferrous metals, mostly copper, were 4% of the weight and 35% of the value in 2025-26. In 2018-19 they were 5% and 24%.
Prices, not tonnes, drove the growth. For non-ferrous metals the weight fell 8% while the declared value nearly tripled. That is mostly the metal price, not more material. Reports in 2026 have put copper at record highs, with the London Metal Exchange cash price reaching about US$14,850 a tonne in August [1], and aluminium crossed US$3,000 a tonne in January for the first time since 2022 [2]. The records do not let us separate price from mix, grade or the exchange rate, so treat the percentage rises as a combination.
Aluminium's per-tonne figure needs care. As the cans series shows in our aluminium and copper article, recorded can weight halved from mid-2025 while value held, which raises the average per tonne. Part of the 71% rise may be classification, not price.
The winners
| Destination | Value 2018-19 | Value 2025-26 | Change | Tonnes 2018-19 | Tonnes 2025-26 |
|---|---|---|---|---|---|
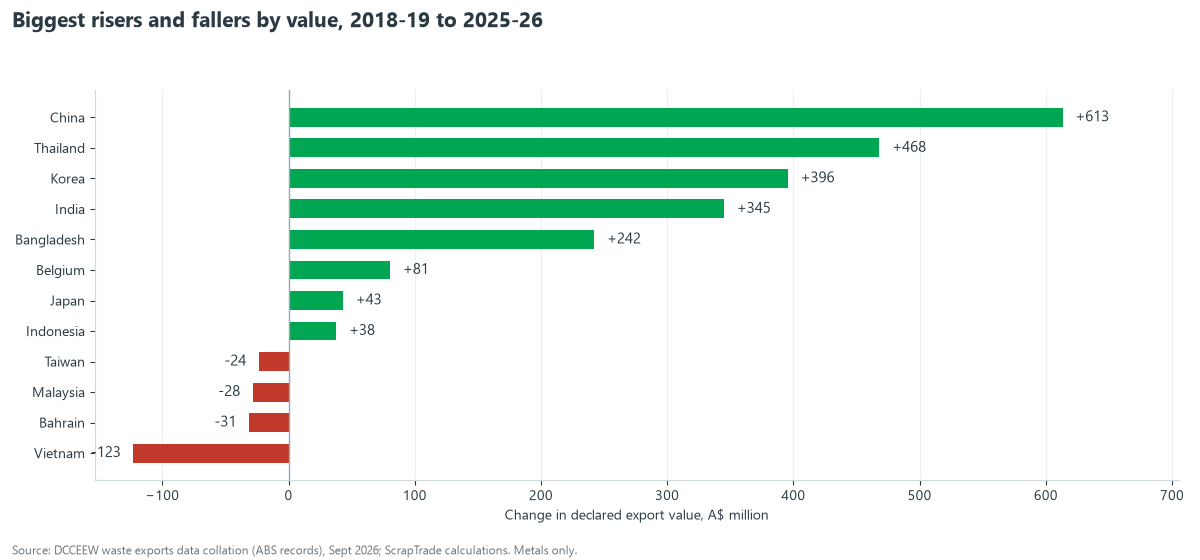
| China | A$391 million | A$1,005 million | +A$613 million | 92,000 | 143,000 |
| Thailand | A$82 million | A$550 million | +A$468 million | 134,000 | 263,000 |
| South Korea | A$122 million | A$518 million | +A$396 million | 99,000 | 99,000 |
| India | A$403 million | A$748 million | +A$345 million | 393,000 | 423,000 |
| Bangladesh | A$148 million | A$391 million | +A$242 million | 299,000 | 810,000 |
Each rose for a different reason.
- China is a copper and aluminium story. Its non-ferrous purchases went from A$270 million to A$687 million and aluminium from A$116 million to A$304 million, on a modest rise in tonnes. It now takes about 22% of the value of all Australian metal scrap.
- Thailand grew in all three metals. Ferrous scrap rose from 123,000 to 199,000 tonnes, and it went from almost no copper (about 1,000 tonnes) to 30,000 tonnes, worth A$212 million, plus aluminium from 10,000 to 34,000 tonnes. It is also the market under the shadow of a proposed import ban, covered in Thailand's Scrap Import Ban Proposal.
- South Korea is the clearest case of mix change. Its tonnes are identical, 99,000 in both years, but its value has more than quadrupled. In 2018-19 most of it was ferrous scrap (69,000 tonnes). Now ferrous is 8,000 tonnes and aluminium is 82,000, with copper-bearing metals worth A$234 million. Same weight, very different business.
- India grew mostly in value, from aluminium (A$206 million to A$417 million) and non-ferrous metals (A$27 million to A$143 million). Its ferrous tonnes barely moved, from 278,000 to 290,000.
- Bangladesh is a ferrous story: from 294,000 to 805,000 tonnes of steel scrap. Its price per tonne is slightly lower than in 2018-19 (about A$481 against A$495) after peaking at A$739 in 2021-22. See Bangladesh: Australia's Top Scrap Customer.
Smaller risers include Belgium (A$39 million to A$119 million, almost all aluminium), Japan (A$54 million to A$97 million) and Pakistan.
The losers, and why base years matter
| Destination | Value 2018-19 | Value 2025-26 | Change | Tonnes 2018-19 | Tonnes 2025-26 |
|---|---|---|---|---|---|
| Vietnam | A$378 million | A$255 million | -A$123 million | 651,000 | 412,000 |
| Malaysia | A$105 million | A$77 million | -A$28 million | 113,000 | 83,000 |
| Taiwan | A$105 million | A$82 million | -A$24 million | 134,000 | 92,000 |
| Netherlands | A$52 million | A$32 million | -A$19 million | 17,000 | 7,000 |
| Bahrain | A$34 million | A$3 million | -A$31 million | 12,000 | 1,000 |
Vietnam is the big loser, down 239,000 tonnes. But 2018-19 was Vietnam's best year in the nine years of data. Measured against its nine-year average of about 418,000 tonnes of ferrous scrap, its 2025-26 level is close to normal. That is the risk in any "seven years ago versus now" comparison: the start year can flatter or punish a market. Check the full series in Bangladesh vs Indonesia vs Vietnam for Scrap.
Malaysia fell mostly in non-ferrous metals (26,000 tonnes to 1,000), and Taiwan has been in decline since 2022-23. See Malaysia's Scrap Import Rules and Taiwan's Scrap Imports. Some small Gulf markets, such as Kuwait and Bahrain, have all but disappeared from the records.
Markets that come and go
Some destinations are not trends at all. India's purchases of metal scrap fell to 164,000 tonnes in 2021-22 and then jumped to 730,000 tonnes in 2023-24, before easing to 423,000. Saudi Arabia took 45,000 and 55,000 tonnes in 2019-20 and 2020-21, almost nothing from 2021-22 to 2023-24, then 41,000 and 67,000 tonnes in the last two years, mostly ferrous scrap. Turkey bought almost nothing in most years but 28,000 tonnes in 2023-24 and 27,000 in 2025-26. If you rely on a market like these, expect to be surprised.
Fewer, bigger customers
| 2018-19 | 2025-26 | |
|---|---|---|
| Top five markets' share of tonnes | 74.7% | 79.8% |
| Top five markets' share of value | 65.0% | 70.1% |
| Top three markets' share of tonnes | 58.4% | 57.6% |
| Markets taking over 1,000 tonnes | 29 | 22 |
The top five by value in 2025-26 were China (22%), India (16%), Thailand (12%), South Korea (11%) and Bangladesh (9%). The share of the top three has barely changed, but the tail has thinned: seven fewer markets took a meaningful amount than in 2018-19. For a seller, that means fewer alternatives if a big buyer changes its rules. The Thai proposal, the EU's draft list and tighter standards in places like Malaysia all affect markets that already carry a lot of weight.
What we left out
The records include a separate "hazardous" group that we have not counted above. Its largest line is slag, ash and residues containing mainly copper. In 2025-26 it was only 845 tonnes, yet worth A$1.64 billion, about A$1.9 million a tonne. Most went to South Korea (495 tonnes, A$988 million) and Canada (290 tonnes, A$570 million). In 2018-19 it was A$288 million. One entry in December 2025 was 164 tonnes to Korea worth A$339 million. This is not scrap in the sense a yard means, and including the whole hazardous group would lift the 2025-26 total from A$4.6 billion to about A$6.3 billion. We keep it separate and cannot explain what the material is beyond its code.
What it means for sellers
- Value moved toward non-ferrous. Copper and aluminium grading pays more than it did seven years ago, and a mistake costs more too. See Copper Scrap: Grades, Prices and Demand and Aluminium Scrap: Grades, Prices and Demand.
- Steel is a volume game on slim prices. Declared value per tonne rose 11% in seven years, against 71% and 198% for the other two. Freight and weighing matter more than ever.
- Do not trust one market. The top five take 80% of the weight. Keep a second buyer for every material. See How to Negotiate a Scrap Deal.
- Ask what the buyer's own rules are. Several big markets are changing theirs.
- A rising price is not a promise. Record metal prices pull more scrap out of the system and can fall back as fast as they rose.
Compare buyers on the marketplace, check indicative prices on the price calculator, or read Australia's Scrap Metal Exports: 2025-26 Data for the latest year in detail.
What we cannot tell you
- How much of the value rise is metal price, exchange rate, grade or mix. The records do not separate them.
- Whether the aluminium cans change is classification or reality.
- What the high-value copper residue line is.
- What caused individual markets' falls, such as Malaysia's and Taiwan's, beyond what is in our country profiles.
Frequently asked questions
Have Australian scrap exports grown?
Metal scrap exports rose 15% in weight and 87% in value between 2018-19 and 2025-26, to 3.05 million tonnes and A$4.58 billion.
Which markets have grown the most?
By value, China (+A$613 million), Thailand (+A$468 million), South Korea (+A$396 million), India (+A$345 million) and Bangladesh (+A$242 million). By weight, Bangladesh grew the most.
Which markets have shrunk?
Vietnam, Taiwan and Malaysia, plus some small Gulf markets. Vietnam's fall is partly a high base year.
Why did the value rise so much more than the weight?
Mostly higher metal prices and a shift in mix from steel towards copper and aluminium. The records do not let us separate them.
Are Australia's scrap customers getting more concentrated?
Yes. The top five markets took 79.8% of the weight in 2025-26, up from 74.7%, and the number of markets taking over 1,000 tonnes fell from 29 to 22.
Sources
- Mining Reporters, Copper price new all-time high, 673 c/lb, London, Cochilco (August 2026), as summarised in search results. We could not open the full article.
- AL Circle, Aluminium's 3,000 ascent in January demands a global price recalculation for the rest of 2026, as summarised in search results.
- Department of Climate Change, Energy, the Environment and Water, Waste exports data collation, September 2026 (ABS records), ScrapTrade calculations. The 2025-26 figures are provisional.
Figures are as reported by the sources named. Export values are border declarations for mixed shipments, not yard prices. This article is general information, not trading advice. ScrapTrade operates a scrap marketplace and has a commercial interest in the scrap trade.