

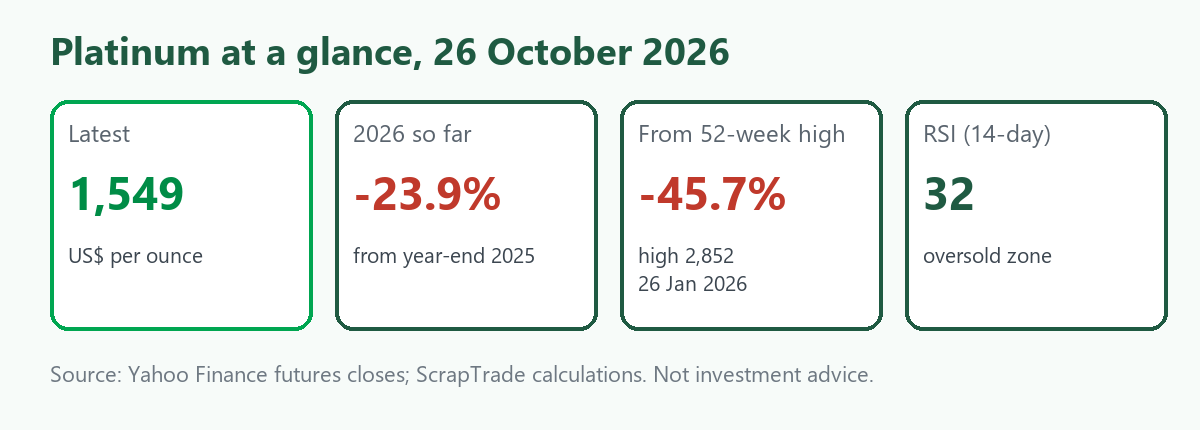
Updated 26 October 2026. For a few weeks in January the platinum group metals were having their best run in years. Platinum, which had spent most of the previous decade in the shadow of gold, closed at US$2,852 an ounce on 26 January, and palladium reached US$2,170 the same day. Nine months later they have given back almost all of it. On 26 October NYMEX platinum closed at US$1,549 an ounce (about A$2,203), 46% below its 52-week high, and palladium closed at US$1,046 (about A$1,487), 52% below its high and at its lowest close in 52 weeks [1].
These metals matter to anyone who handles scrap because catalytic converters are one of the largest uses of both metals, and old converters are one of the richest scrap streams there is. This piece explains what has gone wrong with prices, what the charts say, how the forecasters disagree, and what to watch. It is general information and not investment advice.
What happened
The platinum group metals did not fall because the world suddenly stopped needing them. They fell for the same reasons gold and silver did, with a few of their own.
Investors left. The World Platinum Investment Council (WPIC) reported that in the first quarter of 2026 total supply rose 18% year on year while demand fell 31%, and that the single biggest factor was 374,000 ounces leaving ETFs and exchange stockpiles. It now expects investment demand to fall 18% in 2026 and jewellery demand about 12% [2].
The forecast flipped. Early in the year the WPIC expected a fourth consecutive annual deficit, of 297,000 ounces. Its latest update flips 2026 to a 265,000 ounce surplus, the first projected annual surplus since 2022, though it expects a deficit of 283,000 ounces in the second half. Johnson Matthey, another widely followed forecaster, still counts 2026 as a fourth deficit year, so the experts disagree on the basics [2].
The macro backdrop turned. Rising oil prices after the Middle East conflict pushed up inflation expectations and shifted markets from pricing rate cuts to pricing hikes, which hurt the whole precious metals complex [2]. For the wider story see our analyses of gold and silver.
Palladium coverage is thinner. One first-half review noted that both metals posted double-digit declines in the second quarter, and palladium has fallen 36% this year against platinum's 24% [1][2].
The structural argument has not disappeared. The WPIC estimates that above-ground platinum stocks cover only about four months of global demand, which is why many analysts treat sharp falls as an overreaction, though a thin buffer does not stop prices falling when investors sell.
Platinum: the chart
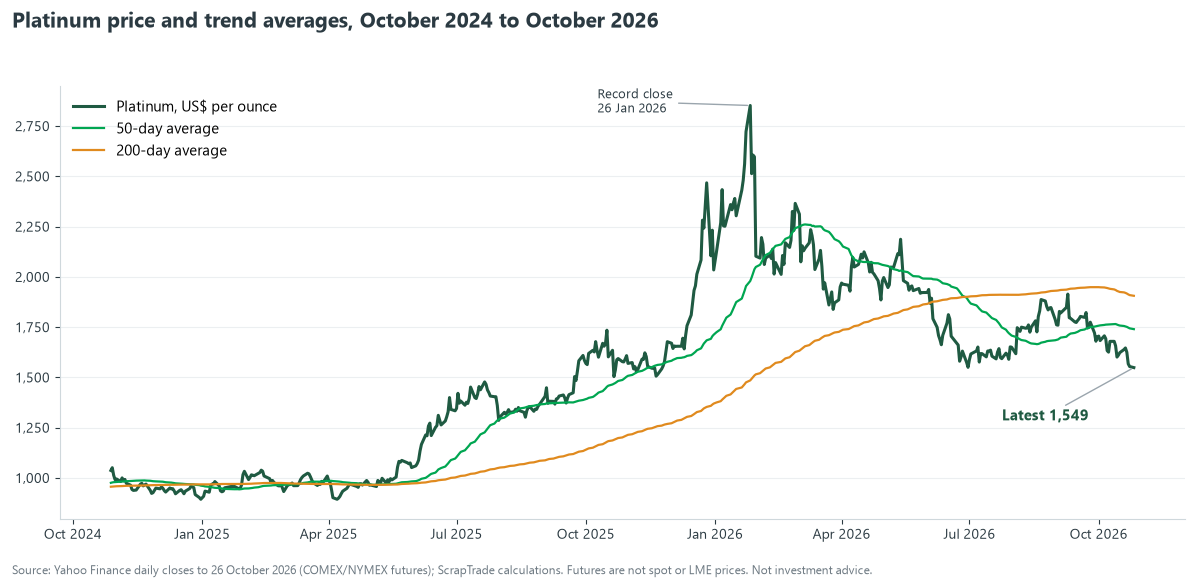
These figures are calculated from NYMEX daily closes.
| Indicator | Platinum | Reading |
|---|---|---|
| Latest close | 1,549 | |
| 20-day average | 1,643 | Price 5.7% below |
| 50-day average | 1,740 | Price 11.0% below |
| 100-day average | 1,705 | Price 9.1% below |
| 200-day average | 1,906 | Price 18.7% below |
| RSI (14-day) | 32.0 | Close to oversold (below 30) |
| MACD (12, 26, 9) | -46.0, signal -38.8 | Downward momentum continues |
| Bollinger band (20-day) | 1,545 to 1,742 | Price on the lower edge |
| Average daily range (14-day) | 28 dollars, 1.8% | |
| Volatility, 30-day and 1-year | 29% and 55% |
Platinum has been in a steady decline since the January peak and sits just above its 52-week low close of US$1,506, set on 20 November 2025. That is the first level to watch. If it breaks, there is little chart support until well below. Resistance sits at the 20-day average (1,643), then the 50-day (1,740) and 100-day (1,705) averages.
Palladium: the chart
| Indicator | Palladium | Reading |
|---|---|---|
| Latest close | 1,046 | A 52-week low |
| 20-day average | 1,123 | Price 6.9% below |
| 50-day average | 1,242 | Price 15.8% below |
| 100-day average | 1,259 | Price 17.0% below |
| 200-day average | 1,432 | Price 27.0% below |
| RSI (14-day) | 26.8 | Oversold |
| MACD (12, 26, 9) | -52.8, signal -49.9 | Downward momentum continues |
| Bollinger band (20-day) | 1,030 to 1,215 | Price near the lower edge |
| Average daily range (14-day) | 19 dollars, 1.8% | |
| Volatility, 30-day and 1-year | 27% and 55% |
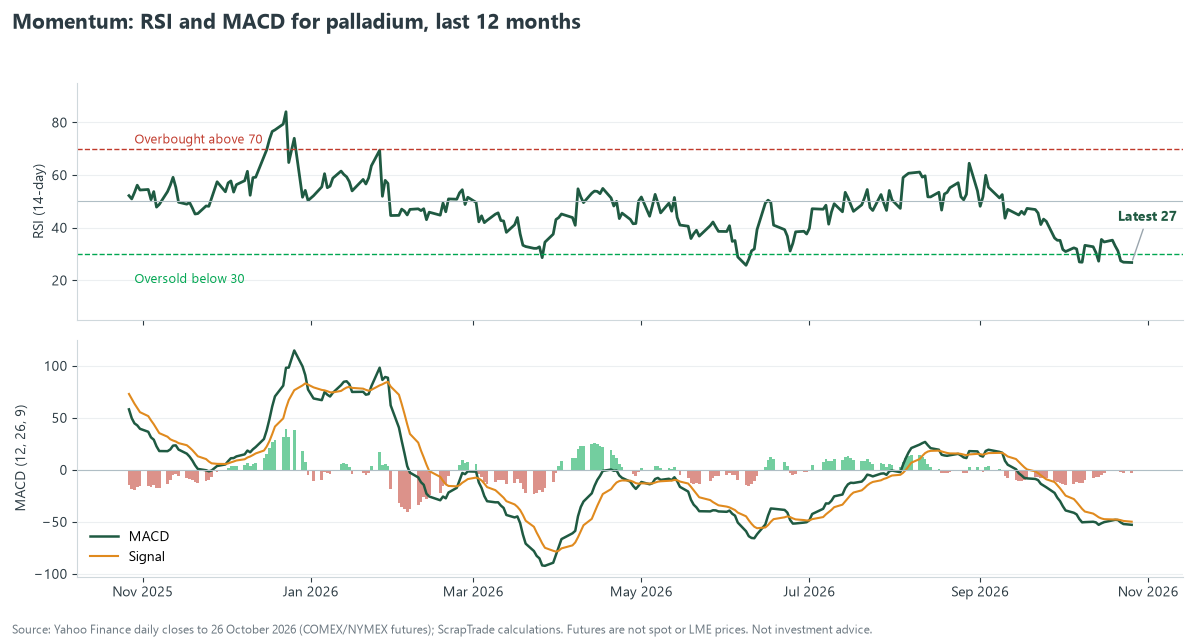
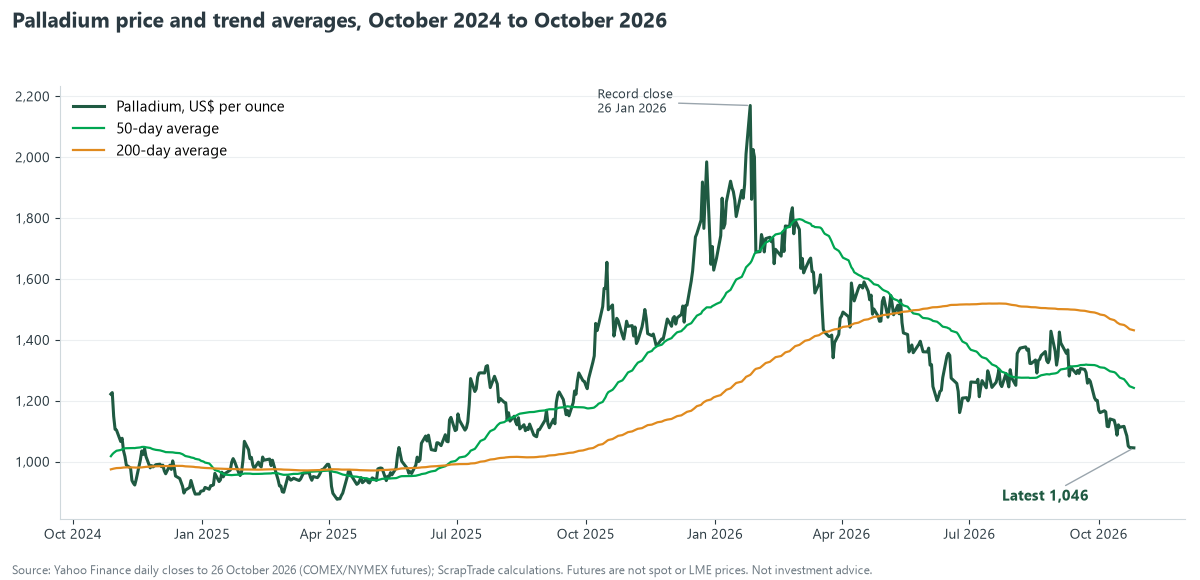
Palladium is the more stretched of the two. An RSI below 30 means the metal has fallen faster than at almost any point in the past year, which can precede a bounce, but a metal can stay oversold for weeks in a trend like this one. Because the latest close is itself the 52-week low, there is no nearby chart support below it, and the first meaningful resistance is the 20-day average near 1,123.
What it looks like in Australian dollars
| Platinum | Palladium | |
|---|---|---|
| US dollars an ounce | 1,549 | 1,046 |
| Australian dollars an ounce | A$2,203 | A$1,487 |
| Australian dollars a gram | A$70.83 | A$47.81 |
| Change in 2026 so far (US$) | -23.9% | -35.8% |
| Change over 12 months (US$) | -2.8% | -28.6% |
| Highest 12-month close (A$) | A$4,126 | A$3,138 |
With the Australian dollar at 70.3 US cents, up 8% in a year, the local price is lower again than the US dollar picture suggests. Platinum is about A$1,900 an ounce below its 12-month high and palladium about A$1,650 below.
What this means for catalytic converter and PGM scrap
Platinum, palladium and rhodium in catalytic converters are recovered by specialist refiners, and what a seller is paid depends on an assay of the material inside, not on the weight of the converter. That makes the price you are quoted far more sensitive to the market than for most scrap. Three practical points:
- Prices move fast. A 1.8% average daily range on a metal worth A$1,500 to A$2,200 an ounce means a lot of money moves in a day. Ask how long a quote is valid.
- Ask how the offer is built. Reputable buyers explain how they assay, what percentage of the metal value they pay and how fees are charged. Compare in writing.
- Know the rules. Catalytic converter theft is a problem, and buying them from the public is regulated in many places. Expect to show identification, keep records and be asked where the material came from. Check your state or territory rules.
The Australian export data show how valuable the recovered end of the chain is. In 2025-26 Australian exporters declared about 453 tonnes of platinum-group scrap worth A$102 million, and about 1,785 tonnes of other precious metal scrap worth A$269 million (an average of about A$224,000 and A$151,000 a tonne), according to the Department of Climate Change, Energy, the Environment and Water [3]. Those categories include more than catalytic converters, so they are not a price for them, but they show why sorting and documentation are worth the trouble. The full picture is in Australia's Scrap Metal Exports: 2025-26 Data.
What to expect
Forecasters genuinely disagree, which is the most honest summary available.
| Source | View |
|---|---|
| WPIC | 2026 surplus of 265,000 ounces, with a 283,000 ounce deficit in the second half. Above-ground stocks cover about four months of demand [2] |
| Johnson Matthey | Still counts 2026 as a fourth consecutive deficit year [2] |
| Market commentary | Much of the fall reflects investment flows, not physical supply, so a turn in sentiment could move prices sharply either way [2] |
| Scenario | What would have to happen | What it would mean |
|---|---|---|
| Bottoming | Investor outflows slow, the dollar and yields stabilise | A base near 1,500 for platinum and 1,000 for palladium, with rallies capped by the 20-day averages |
| Further fall | ETF selling continues, the surplus view spreads, rate-hike fears persist | New lows, with little chart support below |
| Rebound | The second-half deficit appears, investors return, a safe-haven bid revives | A retest of 1,740 for platinum and 1,240 for palladium, the 50-day averages |
Signposts: WPIC's next quarterly update and any revision to its second-half deficit call; ETF holdings; vehicle production and emissions-rule news that affects autocatalyst demand; the Fed on 28 October; oil and the dollar; and the 52-week lows on the charts.
Frequently asked questions
What is the platinum price in Australian dollars?
About A$2,203 an ounce, or A$70.83 a gram, on 26 October 2026, based on NYMEX futures at US$1,549.
What is the palladium price in Australian dollars?
About A$1,487 an ounce, or A$47.81 a gram, based on futures at US$1,046, a 52-week low.
Why have platinum and palladium fallen so much?
Investors sold out of ETFs, the WPIC flipped its 2026 forecast from deficit to surplus, and rising oil prices and rate-hike expectations hit precious metals generally [2].
Is there a platinum shortage?
It depends on who you ask. The WPIC expects a 2026 surplus but a second-half deficit, while Johnson Matthey still sees a deficit year. Above-ground stocks cover about four months of demand [2].
What are catalytic converters worth?
It depends on the platinum, palladium and rhodium inside, which a refiner assays. Prices move daily, so ask for a written quote and its validity.
Sources
- Yahoo Finance, NYMEX platinum futures (PL=F) and palladium futures (PA=F), daily history to 26 October 2026. Indicators and Australian dollar conversions are ScrapTrade calculations.
- World Platinum Investment Council, Fourth consecutive platinum market deficit forecast for 2026 (the original forecast); Platinum and palladium price trends: H1 2026 review and forecast; Platinum's record 2026 rally has given back nearly half its gains. The updated WPIC surplus forecast and Q1 2026 figures are as reported in these and related articles and should be checked against WPIC publications.
- Department of Climate Change, Energy, the Environment and Water, Waste exports data collation, September 2026 (Australian Bureau of Statistics records), ScrapTrade calculations.
This article is general information, not investment, financial or tax advice. Prices, forecasts and news are as reported on 26 October 2026 and change quickly. Futures prices are not spot prices. ScrapTrade operates a scrap marketplace and has a commercial interest in the scrap trade.