

A simple idea runs through the scrap trade: when prices rise, more scrap comes out of the woodwork. Yards pay more, collectors go looking and exporters ship more. Australian customs data lets us test that idea over eight years, and the answer is awkward for it. Copper earned far more per tonne and tonnes barely moved. Aluminium earned more per tonne in 2025-26 and tonnes fell. This article shows the numbers, what published research says, and why we would not use export volumes as a price signal. It is general information, not trading advice.
What we measured, and a warning about "price"
We used the Department of Climate Change, Energy, the Environment and Water (DCCEEW) collation of Australian Bureau of Statistics (ABS) waste export records [1]. We took ferrous scrap (HS 7204), aluminium scrap (HS 7602) and copper and copper-alloy scrap (HS 7404), and removed one record we treat as an error, a 92,400 tonne aluminium line for March 2025 [1].
We do not have a market price series in this dataset. We divided the declared customs value by tonnes to get a value per tonne. That is a rough proxy for the price and it has real weaknesses: it mixes grades, destinations and shipment sizes, and the price in a customs entry may have been agreed well before shipment. It is also not what a collector or small yard is paid. Treat everything below as "what exporters declared", not "what the market paid".
The eight-year picture
| Metal | Tonnes, 2017-18 | Tonnes, 2025-26 | Change | A$ per tonne, 2017-18 | A$ per tonne, 2025-26 | Change |
|---|---|---|---|---|---|---|
| Ferrous scrap | 2,026,848 | 2,547,805 | +26% | 503 | 600 | +19% |
| Aluminium scrap | 293,110 | 377,501 | +29% | 2,128 | 3,790 | +78% |
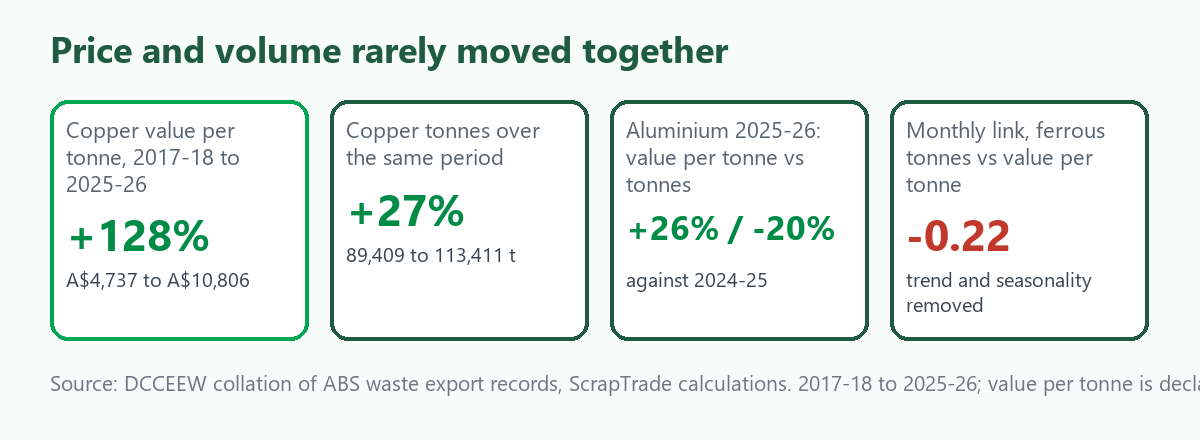
| Copper and copper alloys | 89,409 | 113,411 | +27% | 4,737 | 10,806 | +128% |
Source: DCCEEW collation of ABS waste export records, ScrapTrade calculations. Financial years. 2025-26 is provisional.
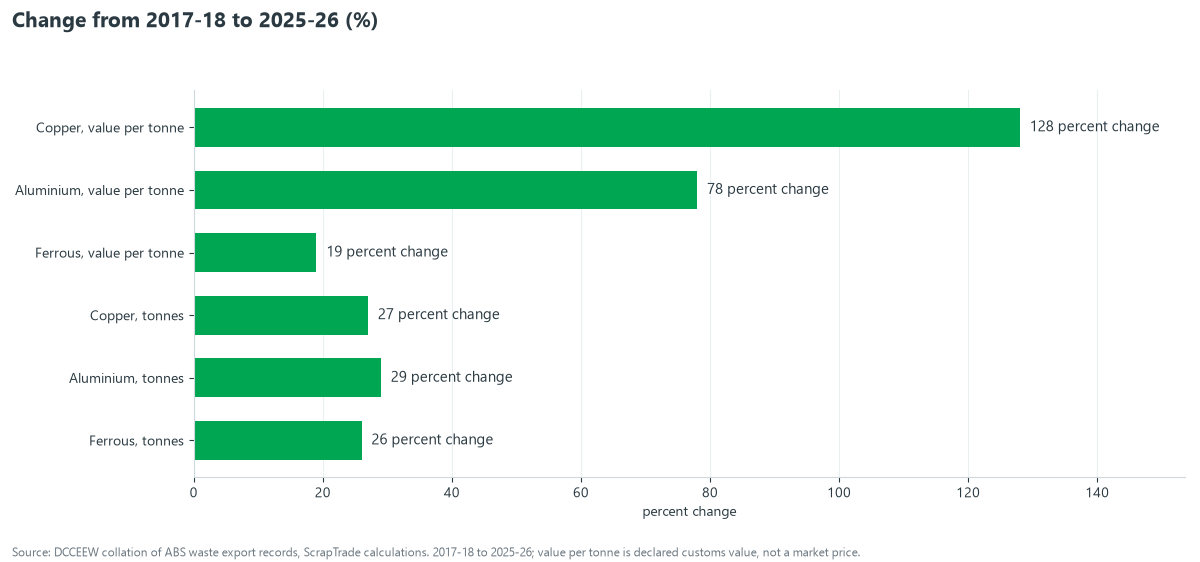
Copper's declared value per tonne more than doubled, and tonnes rose by roughly the same percentage as the other two metals. The three metals show quite different price moves and almost the same volume move. That is the opposite of what "more money, more scrap" would predict.
Year by year
Three episodes stand out.
- Aluminium, 2025-26. Value per tonne rose 26% on 2024-25 (A$2,999 to A$3,790) while tonnes fell 20% (474,323 to 377,501). The price proxy and the volume moved in opposite directions.
- Ferrous, 2020-21 to 2021-22. Value per tonne jumped 34% (A$524 to A$701) while tonnes fell 1.8% (1,996,697 to 1,960,292).
- Ferrous, 2021-22 to 2025-26. Value per tonne drifted down 14% (A$701 to A$600) while tonnes rose 30% (1,960,292 to 2,547,805).
These do not prove that price does not matter. Possible explanations include less domestic steelmaking for ferrous scrap, and more aluminium melted at home or held back, but we do not have data to test them.
Month by month
We also looked at the 102 months from January 2018 to June 2026. For each metal we removed the trend and the seasonal pattern described in Australia's Scrap Exports by Month, then correlated the remaining ups and downs in tonnes with those in value per tonne.
| Metal | Same month | Value per tonne leading by 1 month | by 2 months | by 3 months |
|---|---|---|---|---|
| Ferrous scrap | -0.22 | -0.21 | -0.08 | 0.08 |
| Aluminium scrap | -0.19 | -0.21 | 0.04 | 0.07 |
| Copper and copper alloys | -0.50 | -0.31 | 0.01 | 0.12 |
Source: ScrapTrade calculations from the DCCEEW collation. A correlation of 1 is a perfect link, 0 is none, and negative means they move opposite ways.
At lags of two or three months the numbers sit near zero, and at six months they are 0.14, -0.09 and -0.06 for ferrous, aluminium and copper. The same-month figures are negative, most strongly for copper. We would not read that as "higher prices cut exports". A large shipment can lower the average value per tonne by adding lower-grade material to the mix, which would make big months look cheap. The honest reading is that this proxy shows no consistent positive link between value per tonne and tonnes.
We did the same comparison on annual changes, and copper showed a correlation of 0.51, but that rests on only eight yearly changes and we do not rely on it.
What published research says
Two peer-reviewed studies point the same way, though neither is about Australia.
- Secondary aluminium, Western Europe. Blomberg and Söderholm estimated the own-price elasticity of secondary aluminium supply at 0.21 using data for Germany, France, Italy and the UK from 1983 to 2000. They describe this as low, as is the response to changes in the stock of old scrap. They add that low supply responses help explain the volatility of secondary aluminium prices [2]. An elasticity of 0.21 means a 10% price rise was associated with about a 2% rise in supply.
- Recycled copper. Fu, Ueland and Olivetti, from MIT, modelled recycled copper supply and found that industrial activity and world GDP correlate with total scrap supply, with limited dependence on copper price. A 1% rise in industrial production led to a 2.1% rise in higher-quality scrap and a 1% rise in world GDP to a 1.4% rise in lower-quality scrap [3].
Their reasoning is the one the trade will recognise. What can be collected today comes from products made years ago, so supply depends mainly on what has reached end of life and on how much is being built, demolished and thrown away, not on a quote this month. The papers are about different places and periods from our data and we have read only the published abstracts, so we cite them as direction, not proof.
Precious metals appear to be different. In an analysis we cite in Catalytic Converter Scrap, the World Platinum Investment Council said the fall in the platinum group metals price from 2022 to 2024 reduced recycling supply, which suggests a more price-responsive stream [4]. WPIC is an industry body for platinum investment, and we did not test this in Australian data.
A scenario: a spike in copper
Leila runs a small yard in Perth (invented). Copper jumps and she wonders whether to expect a flood of material.
- She checks the stock behind the price. In general, copper wire, pipe and cable reach a yard when buildings are stripped and equipment is retired, and that does not obviously speed up because of a quote.
- She expects more competition for the same material, not a sudden larger pool. Buyers who raise their prices to attract supply are bidding for what exists.
- She focuses on grade and sorting. On the ScrapTrade index, moving a tonne from Copper 2 to Copper 1 is worth about A$1,139. When prices run, the gap in dollars grows.
- She does not read a busy week as a market signal. Volumes also swing with the calendar, as in Australia's Scrap Exports by Month.
What this means for you
- Do not use export volumes to guess prices, or the reverse. The link is weak in our data and in the research.
- Expect rising prices to change who pays what, more than how much scrap exists.
- Compete on grade, sorting and reliability, which you control, rather than waiting for a price to pull material in.
- Look at price on its own. See How Scrap Prices Are Set for the benchmarks the trade uses.
- Check destinations. Who is buying matters more than the total. See Who Buys Australian Aluminium and Copper Scrap and Australian Scrap Exports: Seven Years of Change.
You can compare buyers on the marketplace or register.
What we could not confirm
- A real price series. We used declared value per tonne, not LME or yard prices, and did not test against market prices.
- Causes. The data shows no consistent link. It does not say why aluminium fell in 2025-26 or why ferrous rose as its value fell.
- Domestic use. We have no figure for how much scrap is melted in Australia, so we cannot separate "less collected" from "more kept at home".
- Australian supply elasticities. The studies we cite are European and global, and we read only abstracts.
- Lags longer than three months, and effects that depend on currency moves.
Frequently asked questions
Do higher scrap prices bring out more scrap?
In Australian export data we found no consistent positive link between value per tonne and tonnes. Research on aluminium and copper scrap finds weak supply responses to price [2][3].
Why did aluminium scrap exports fall in 2025-26 when value per tonne rose?
Tonnes fell 20% while declared value per tonne rose 26% (A$2,999 to A$3,790) [1]. The data does not show why.
Did copper scrap exports rise when copper became more valuable?
Declared value per tonne rose 128% from 2017-18 to 2025-26, and tonnes rose 27% [1].
Is the value per tonne in customs data the market price?
No. It is a proxy that mixes grades, destinations and shipment sizes, and prices are usually agreed before shipping.
Is scrap supply the same for precious metals?
WPIC reports that falling platinum group metal prices reduced recycling supply in 2022 to 2024, which suggests more price response than in base metals [4].
Sources
- Department of Climate Change, Energy, the Environment and Water, Waste exports data collation, September 2026 (ABS records), ScrapTrade calculations. 2025-26 figures are provisional.
- Blomberg and Söderholm, The economics of secondary aluminium supply: An econometric analysis based on European data, Resources, Conservation & Recycling 53(8), 2009. Abstract read.
- Fu, Ueland and Olivetti, Econometric modeling of recycled copper supply, Resources, Conservation and Recycling 122, 2017. Abstract read.
- World Platinum Investment Council, End of life autocatalysts are a key source of recycling supply, however, only at economically viable PGM prices (20 August 2025). WPIC does not provide investment advice.
Figures are ScrapTrade calculations from customs records and are not forecasts. Customs values are not market prices. The scenario is invented. This article is general information, not trading advice. ScrapTrade operates a scrap marketplace and has a commercial interest in the scrap trade.