

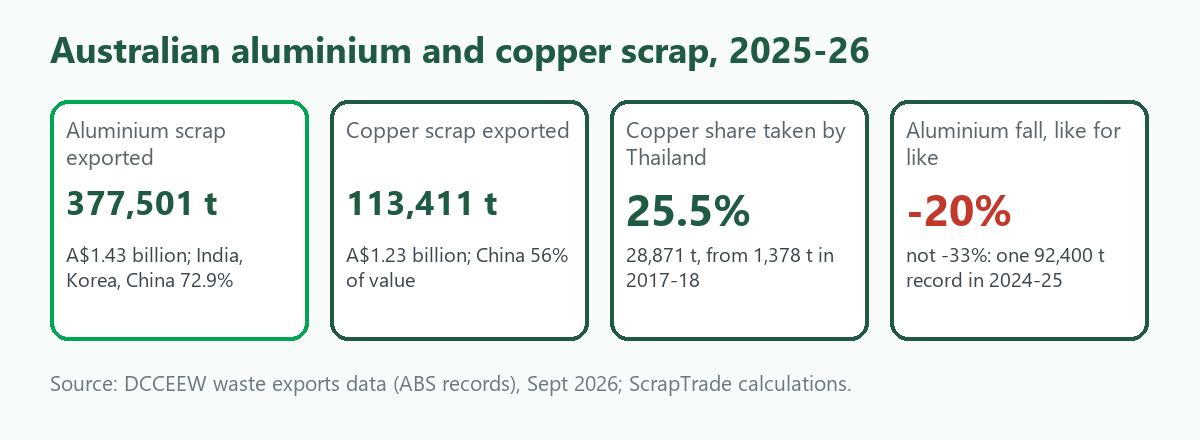
Updated 27 October 2026. Australia sold overseas 377,501 tonnes of aluminium scrap and 113,411 tonnes of copper-bearing scrap in 2025-26, together worth about A$2.66 billion. The two metals go to different places. Aluminium is a three-buyer market, led by India, South Korea and China, with a long tail. Copper is led by China, but a market that barely existed seven years ago, Thailand, now takes a quarter of the tonnes. This article uses Australian export records to show who buys each metal, what they pay a tonne, how the lists have changed and where the data needs care. It is general information, not trading advice.
The source is the Department of Climate Change, Energy, the Environment and Water's collation of Australian Bureau of Statistics export records, released in September 2026. We count aluminium as HS 7602 and copper, brass and refined copper scrap as HS 7404. Financial years run July to June, and 2025-26 is the latest. The wider picture is in Australia's Scrap Metal Exports: 2025-26 Data.
One record to know about before reading any total
In March 2025 the export records contain a single entry of 92,400 tonnes of aluminium scrap from Townsville to South Korea, declared at A$253,796. That is under A$3 a tonne, against about A$3,060 a tonne for the rest of the aluminium shipped that month, so the weight is almost certainly a recording error or a different material filed under the aluminium code. We cannot say which, and we cannot see the original shipping document.
It matters because it makes 2024-25 look like Australia's biggest aluminium year. As recorded, 2024-25 shows 566,723 tonnes, and 2025-26 looks like a 33% collapse to 377,501 tonnes. Without that one record, 2024-25 is 474,323 tonnes and the fall is 20%. The value is not affected in any meaningful way, because the entry carries almost no value. Every 2024-25 aluminium figure below excludes that record, and we say so each time. Any earlier comparison you have seen that uses the raw total, including in some of our own earlier articles, overstates the drop.
Aluminium: three buyers and a long tail
In 2025-26 the largest buyers of Australian aluminium scrap were these.
| Destination | Tonnes | Share of tonnes | Share of value | Average A$ per tonne |
|---|---|---|---|---|
| India | 114,657 | 30.4% | 29.2% | 3,638 |
| South Korea | 82,302 | 21.8% | 19.2% | 3,344 |
| China | 78,278 | 20.7% | 21.2% | 3,879 |
| Thailand | 34,066 | 9.0% | 8.8% | 3,695 |
| Belgium | 17,065 | 4.5% | 7.1% | 5,988 |
| Indonesia | 13,040 | 3.5% | 3.4% | 3,755 |
| Malaysia | 9,968 | 2.6% | 2.4% | 3,430 |
| Vietnam | 7,208 | 1.9% | 2.2% | 4,295 |
India, Korea and China together took 72.9% of the weight, and the top five took 86.5%. Thirty destinations received at least some aluminium scrap. Source: DCCEEW export data collation, ScrapTrade calculations.
The same metal, two different products
Aluminium scrap has two separate codes in the records: used beverage cans and everything else. The buyers want very different things.
| Destination | Share of its tonnes that is cans | Cans, A$ per tonne | Other aluminium, A$ per tonne |
|---|---|---|---|
| South Korea | 46% | 3,435 | 3,267 |
| India | 38% | 2,944 | 4,057 |
| Thailand | 23% | 3,447 | 3,769 |
| China | 6% | 1,860 | 4,006 |
| Belgium | 0% | none | 5,988 |
China takes almost no cans from Australia. It buys mostly mixed and sorted aluminium, at about A$4,000 a tonne. Korea does the opposite: close to half of what it receives is cans, which suits a remelter feeding beverage-sheet alloys. India sits in the middle and pays about A$4,057 a tonne for its non-can material, slightly above China. Belgium is the outlier. It takes no cans and pays about A$5,988 a tonne, nearly 50% more than India's non-can price. The records do not describe alloy or quality, so we cannot say whether that reflects cleaner material, particular alloys, shipping terms or a handful of high-value consignments. It is worth a seller's attention rather than a conclusion.
The cans shortfall
Cans are where the real change sits. They ran at roughly 14,000 to 25,000 tonnes a month through April 2025, then fell to 12,192 tonnes in May 2025 and 9,218 in June. Since July 2025 they have stayed near 8,000 to 9,000 tonnes a month, apart from December 2025 at 10,970 and January 2026 at 6,561. For 2025-26 cans total 102,150 tonnes, against 214,964 tonnes in 2024-25, a fall of 52%, while other aluminium rose 6% from 259,359 to 275,352 tonnes.
The strange part is the money. The monthly value of cans has fallen far less, mostly around A$25 million a month in 2025-26 against A$29 to 41 million a month a year earlier, so the declared price per tonne has jumped from under A$2,000 to A$3,065. A real halving in volume combined with a doubling in price is possible, but it is also what a change in how consignments are classified or weighed would look like. The records do not tell us which. For anyone selling cans, the practical point is to compare your offers with today's buyers, not with 2024.
Copper: China first, Thailand second
| Destination | Tonnes | Share of tonnes | Share of value | Average A$ per tonne |
|---|---|---|---|---|
| China | 38,970 | 34.4% | 56.0% | 17,606 |
| Thailand | 28,871 | 25.5% | 17.1% | 7,264 |
| India | 17,269 | 15.2% | 11.3% | 8,049 |
| South Korea | 7,899 | 7.0% | 10.4% | 16,155 |
| Pakistan | 6,938 | 6.1% | 1.1% | 1,985 |
| Bangladesh | 3,660 | 3.2% | 0.2% | 559 |
| Indonesia | 3,444 | 3.0% | 0.2% | 682 |
Source: DCCEEW export data collation, ScrapTrade calculations. Twenty-two destinations took copper scrap, and the top three took 75.0% of the weight.
Why China's share of value is bigger than its share of weight
China and South Korea pay about A$16,000 to A$17,600 a tonne. Thailand and India pay under half that. The difference is the product. Of the copper that China received, 29,876 tonnes was the copper-alloy code at an average of about A$19,073 a tonne, plus 7,603 tonnes of brass and 1,491 tonnes of refined scrap. Thailand's mix is heavier in the refined copper code (8,144 tonnes at about A$4,847 a tonne) and lower-priced alloy material (18,692 tonnes at about A$7,878 a tonne). The category names are broad, so they do not tell us the grade, but they are consistent with China buying the higher-value, cleaner material and Thailand and India buying lower-value, mixed or more processed lots.
Three prices that do not look like copper
Pakistan (A$1,985 a tonne), Indonesia (A$682) and Bangladesh (A$559) show declared values far below any ordinary price for copper-bearing metal. Bangladesh, for example, appears to have bought 3,660 tonnes of "copper alloys" scrap worth A$2.05 million. A real tonne of copper alloy scrap is worth many times that. We cannot explain it from the records: the material could be very low-grade or heavily contaminated, such as slag, ash or residues, or the values could be understated or mis-entered. The three together are only 12.4% of the copper weight and 1.5% of its value, so they do not change the overall picture, but nobody should read these averages as what a Pakistani or Bangladeshi buyer pays for scrap copper.
How the buyer lists have changed since 2017-18
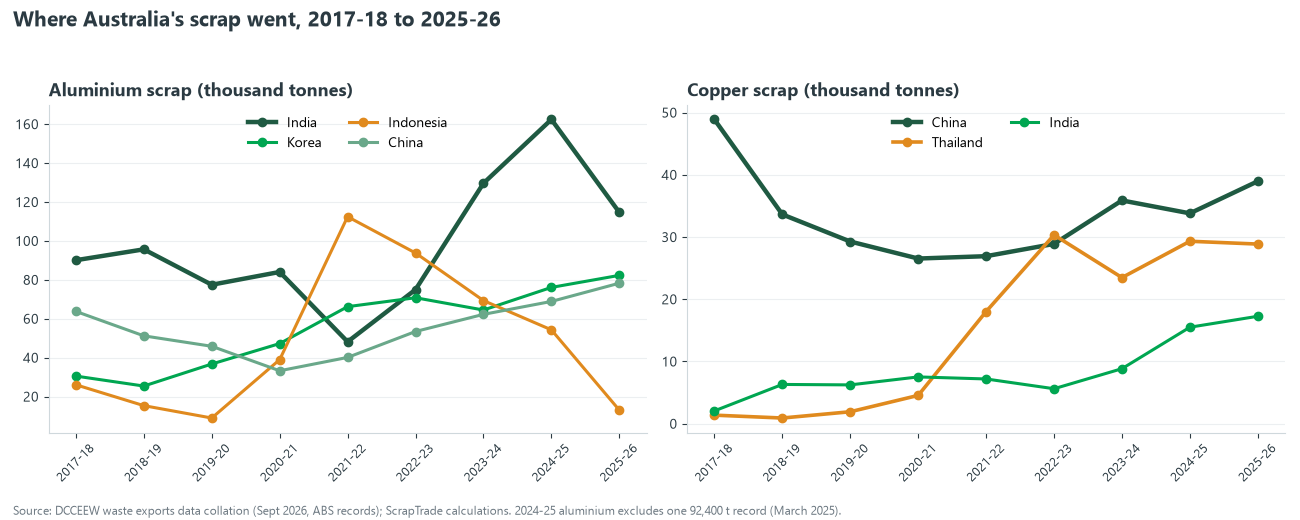
The charts above show the movement in thousand tonnes, with 2024-25 aluminium adjusted for the single record described earlier.
- Indonesia fell off a cliff in aluminium. It took 112,448 tonnes in 2021-22, 93,790 in 2022-23 and 69,340 in 2023-24, then 54,295 and now 13,040. That is an 88% drop from the peak. Malaysia went from 41,926 tonnes in 2023-24 to 9,968. We have not found a source explaining either decline, so we do not offer a reason.
- South Korea more than doubled. From 30,537 tonnes in 2017-18 to 82,302, and 46% of what it received in 2025-26 was cans. See South Korea's Scrap Market for its side of the trade.
- India is the biggest but not steady. From 90,090 tonnes in 2017-18 to a peak of 162,419 in 2024-25, then 114,657 in 2025-26, a 29% fall in a year.
- Thailand went from a minor buyer to a major one in copper. From 1,378 tonnes in 2017-18 to 18,025 in 2021-22, a peak of 30,337 in 2022-23 and 28,871 in 2025-26. India has gone from 2,062 tonnes to 17,269.
- China's copper has been flat to lower. 48,897 tonnes in 2017-18, a low of 26,547 in 2020-21 and 38,970 now. It remains the biggest buyer by value because it takes the pricier grades.
- Pakistan and Bangladesh come and go. Pakistan took 13,527 tonnes in 2020-21, then 3,367 in 2022-23 and 6,938 now. Bangladesh took 8,199 tonnes in 2017-18, almost nothing from 2018-19 to 2022-23, and 3,660 last year.
The lesson is that a buyer's share is not a loyalty. Over nine years every large destination has moved by tens of thousands of tonnes.
What buyers' own rules say
The import side explains part of the picture, though not all of it.
India. India imposes a 2.5% basic customs duty on aluminium scrap. In July 2026, the Material Recycling Association of India and the Aluminium Secondary Manufacturers Association were calling for it to be removed, while the Aluminium Association of India asked the government to notify a long-pending BIS quality standard for scrap, keep the 2.5% duty until then and, once grade codes exist, raise it to 7.5% on the lowest grades. AL Circle's report puts India's aluminium scrap imports at about 2 million tonnes and cites the recyclers' association saying imports cover 80 to 85% of raw material needs [1][2]. We could not find a final decision. A removal of duty would help exporters, and a quality standard would reward cleaner, graded material. See India's Scrap Market: Imports, Duties, Rules.
China. SMM reports China imported 1.2415 million tonnes of copper scrap in the first half of 2026, up 8.39% on the year, with Thailand the largest supplier at 200,500 tonnes (up 55.33%) and Japan second at 198,000 tonnes. It says domestic supply of tax-invoiced scrap is tight because of reverse-invoicing enforcement, which keeps demand for imported material firm [3]. The strength of Thailand as a source to China raises a question we cannot answer from these records: how much of the copper Australia sends to Thailand is processed there and passed on. Thai trade is also under a cloud, since Thai Customs proposed an import ban on these codes on 21 October 2026, covered in Thailand's Scrap Import Ban Proposal. About 98% of Australia's A$559 million of sales to Thailand sits in the codes named. For China's rules see China's Copper and Aluminium Scrap Rules.
Where it leaves sellers
- Check the product, not just the metal. Cans, sorted extrusion and mixed aluminium are sold into different markets at different prices. A buyer in Korea values cans, one in China wants sorted non-can material.
- Concentration is a risk. Three buyers take nearly three-quarters of each metal, and Thailand alone takes a quarter of the copper. A rule change in one of them moves the whole list. Keep a second buyer warm.
- Treat averages as direction, not prices. The A$3,000 to A$6,000 aluminium averages and the A$1,985 and A$559 copper averages describe mixed border declarations, not yard prices. Use live material prices and compare real offers.
- Note the grading advantage. If India does adopt a graded standard, clean sorted aluminium becomes easier to sell at a premium.
- Where it comes from matters too. Victoria supplied 150,292 tonnes of aluminium in 2025-26, Queensland 88,172 and New South Wales 81,433. For copper, New South Wales supplied 31,179 tonnes, Victoria 30,491 and Queensland 25,077. The biggest single aluminium flow was Victoria to India, at 44,900 tonnes.
To see who is buying right now, browse the ScrapTrade marketplace or post what you have for sale. If you do not want to run the sale yourself, you can hire a scrap agent, and you can register on ScrapTrade to list your material. For grade detail see Aluminium Scrap: Grades, Prices and Demand and Copper Scrap: Grades, Prices and Demand.
What we could not establish
- Whether the 92,400 tonne record is an error or a misclassified material.
- Why recorded cans volume halved from mid-2025 while value held.
- What explains Belgium's price premium and the very low copper values for Pakistan, Bangladesh and Indonesia.
- How much of the copper Australia sells to Thailand is passed on to China.
- Whether India will remove its duty or introduce graded standards.
Frequently asked questions
Who is the biggest buyer of Australian aluminium scrap?
India, with 114,657 tonnes and 29.2% of value in 2025-26. South Korea and China follow.
Who is the biggest buyer of Australian copper scrap?
China, with 34.4% of the weight and 56.0% of the value in 2025-26. Thailand is second by weight.
Did Australia's aluminium scrap exports really fall by a third?
Not on a like-for-like basis. One 92,400 tonne record in March 2025 inflated the previous year. Without it the fall is about 20%.
Why does China pay so much more per tonne for copper?
Because it receives more of the higher-value copper-alloy code. The records do not show grade, so the reason is inferred from the product codes.
Are the export prices what I will be paid?
No. They are declared values of mixed shipments at the border, not yard prices.
Sources
- SMM, India Debates Aluminium Scrap Import Duty as Recyclers Call for Tariff Removal (7 July 2026).
- AL Circle, Aluminium Association of India seeks BIS implementation amid concerns over low grade aluminium scrap dumping (9 July 2026).
- SMM, Review of China's Copper Scrap Import Market in H1 2026 and Outlook for H2.
- Department of Climate Change, Energy, the Environment and Water, Waste exports data collation, September 2026 (ABS records), ScrapTrade calculations. Aluminium is HS 7602, copper, brass and refined copper scrap HS 7404. The 2024-25 aluminium figures exclude one March 2025 record of 92,400 tonnes.
Figures are from the sources named, and the 2025-26 export data are provisional. Export values are border declarations for mixed shipments, not yard prices. This article is general information, not trading advice. ScrapTrade operates a scrap marketplace and has a commercial interest in the scrap trade.