

Most of what is published about Australian scrap exports starts from one source: the government's waste exports data, built from Australian Bureau of Statistics records. It is a good source. It is also a customs dataset, not a price list, and a few features of it can quietly change a headline number. This guide shows what is inside the 2025-26 figures, which records do not look right, what is missing, and how we handle each when we publish charts such as Scrap Metal Price Chart Australia: 8 Years. It ends with eight checks you can run on any export figure you see, ours included. We have a commercial interest in the scrap trade.
What one record is
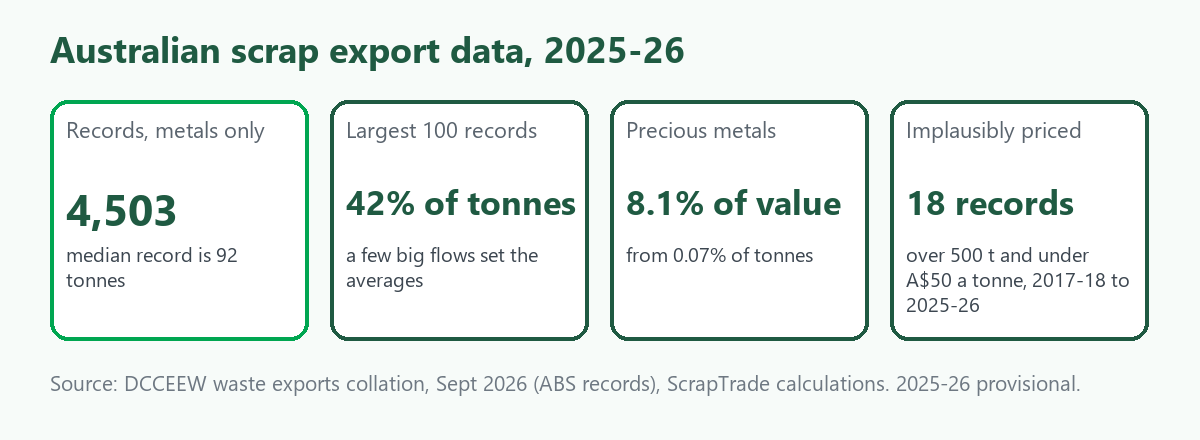
The dataset comes from the Department of Climate Change, Energy, the Environment and Water (DCCEEW). Each row is a month, a state of origin, a port, a destination country and a customs product code, with tonnes and declared value. Filtered to metals, 2025-26 (provisional) has 4,503 rows covering 3,045,991 tonnes and A$4,578.7 million declared.
Rows are small in the middle and heavy at the top. The median row is 92 tonnes, but the largest 100 rows carry 42.3% of all tonnes. Averages across the dataset therefore follow a few big flows, and one oversized row can move a line.
What is inside the totals
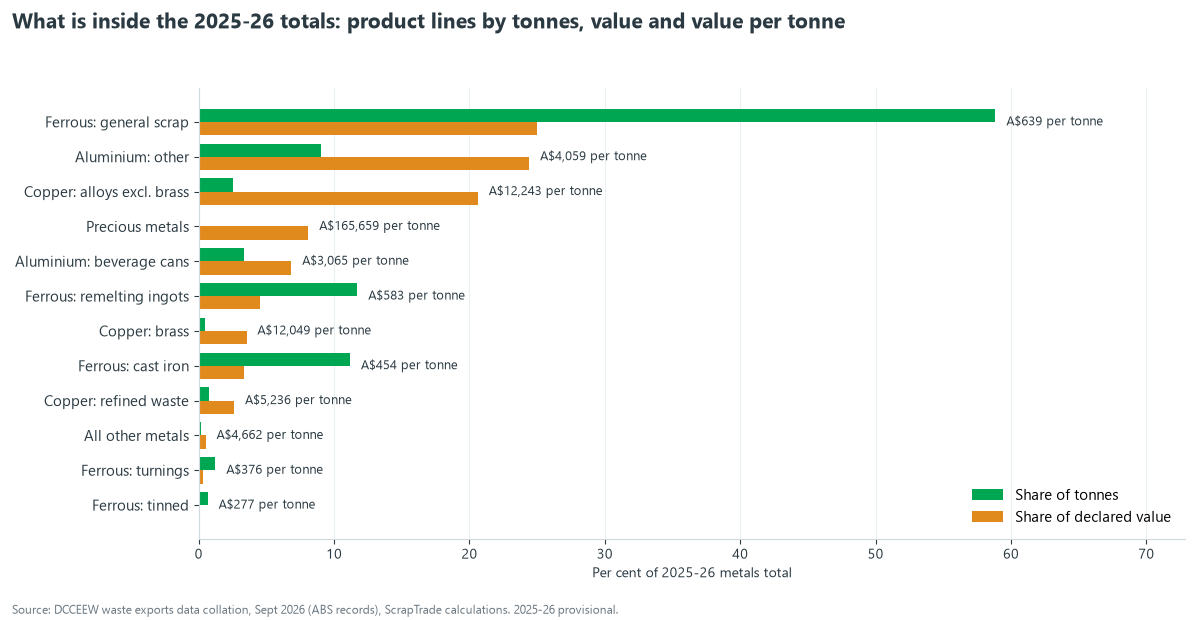
The word "metals" covers very different goods. The chart splits 2025-26 by product line, and the table gives the same numbers for the biggest lines.
| Product line (2025-26) | Tonnes | Share of tonnes | Share of declared value | Declared value per tonne |
|---|---|---|---|---|
| Ferrous, general scrap | 1,792,569 | 58.9% | 25.0% | A$639 |
| Ferrous, remelting ingots | 356,991 | 11.7% | 4.5% | A$583 |
| Ferrous, cast iron | 340,425 | 11.2% | 3.4% | A$454 |
| Aluminium, other than cans | 275,352 | 9.0% | 24.4% | A$4,059 |
| Aluminium, beverage cans | 102,150 | 3.4% | 6.8% | A$3,065 |
| Copper alloys, excluding brass | 77,109 | 2.5% | 20.6% | A$12,243 |
| Refined copper waste | 22,885 | 0.8% | 2.6% | A$5,236 |
| Brass | 13,418 | 0.4% | 3.5% | A$12,049 |
| Precious metals | 2,238 | 0.07% | 8.1% | A$165,659 |
Two things follow. First, "copper" and "aluminium" are not single goods: copper runs from A$5,236 to A$12,243 a tonne across its lines, and aluminium beverage cans sit about A$1,000 a tonne below other aluminium. A change in the mix between lines looks like a change in price. We found exactly that in aluminium, where a shift in the beverage-can part of the trade drove most of the rise in 2025-26, as set out in the price chart post.
Second, the whole-metals average is not a scrap price. Across all metals the 2025-26 figure is A$1,503 a tonne; with the precious-metals rows removed it is A$1,382. A line that is 0.07% of tonnes lifts the average by about 9%, because it carries 8.1% of the value. Any "average scrap value per tonne" that includes the precious-metals code is describing jewellery and catalyst-type material as much as scrap.
Records that do not look like the rest
We scanned every metal record from 2017-18 to 2025-26, leaving out precious metals, for rows over 500 tonnes declared at under A$50 a tonne. Ferrous scrap sells for hundreds of dollars a tonne, so a row of that size at that value is not a normal sale.
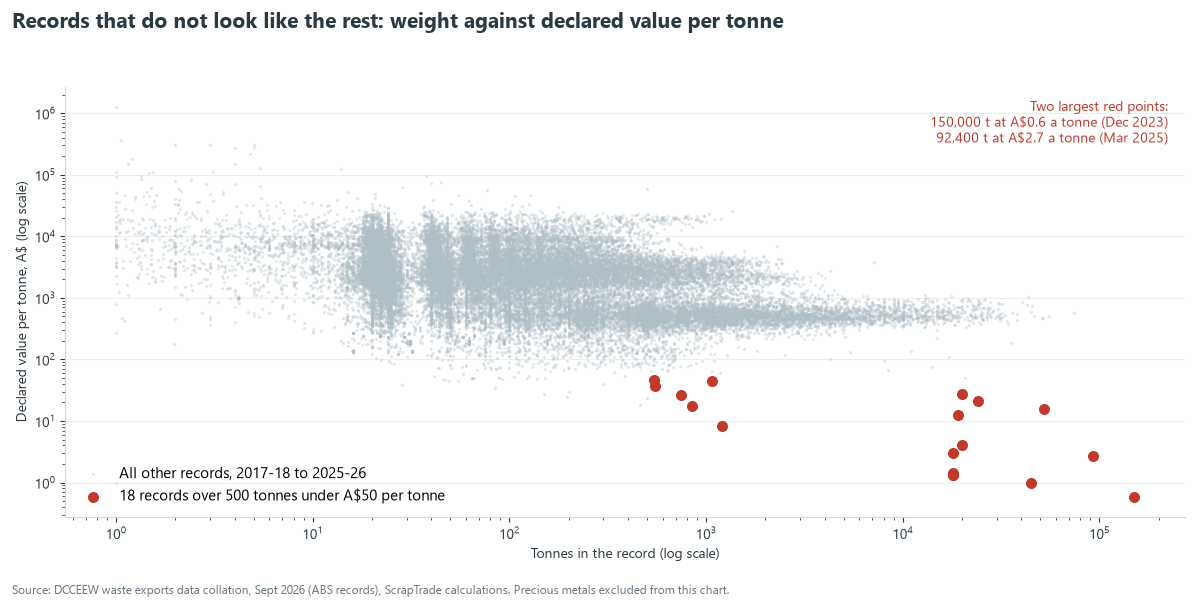
There are 18. They total 500,176 tonnes, 2.1% of all metal tonnes in the period, with a combined declared value of A$2.86 million. Seventeen are ferrous scrap, two of them cast iron, and one is aluminium. The largest:
| Month | Tonnes | Declared value | Per tonne | Metal | Route |
|---|---|---|---|---|---|
| Dec 2023 | 150,000 | A$86,795 | A$0.6 | Ferrous | Re-exports, via Brisbane, to India |
| Mar 2025 | 92,400 | A$253,796 | A$2.7 | Aluminium | Queensland, via Townsville, to South Korea |
| May 2022 | 52,287 | A$823,058 | A$15.7 | Ferrous | New South Wales to India |
| Jan 2018 | 45,000 | A$43,416 | A$1.0 | Ferrous | New South Wales to the UAE |
| Dec 2022 | 24,246 | A$514,752 | A$21.2 | Ferrous | New South Wales to India |
Three more rows of exactly 18,000 tonnes went from New South Wales to Nigeria in 2018-19 and 2019-20, each declared at between A$23,900 and A$25,400.
Is it a units slip? One explanation is that some of these were entered in kilograms instead of tonnes. We tested it by dividing each row's tonnes by 1,000 and asking whether the implied value per tonne then lands in a normal range for the metal. Three do: the 150,000 tonne row would be 150 tonnes at A$579, the 45,000 tonne row 45 tonnes at A$965, and the 92,400 tonne aluminium row 92.4 tonnes at A$2,747, close to the national aluminium line. For the other 15 the test does not help: some stay far too cheap, and others become far too expensive. So a units slip may explain a few and cannot be shown for most. We do not know the cause, and we cannot see the original customs entries.
What they do to the numbers. Mostly little. Ferrous scrap is large enough to absorb them: in 2023-24, leaving out that year's two flagged rows (the 150,000 and 1,210 tonne rows) changes the ferrous figure from A$664 to A$708 a tonne, a 7% difference. Aluminium is smaller, so the 92,400 tonne row matters. It is about 16% of that year's aluminium tonnes, and including it would have pulled the 2024-25 average down sharply and made the 2025-26 rise look larger.
What is missing or labelled oddly
- Port of loading is blank on every metal row in 2017-18 and 2018-19 and on about half of 2019-20. From 2020-21 it is filled in. Port comparisons across all years are therefore not possible, and we use ports for recent years only.
- State of origin is sometimes "Re-exports", meaning the goods were not Australian-origin in the usual sense. These rows are 0.9% to 5.6% of metal rows depending on the year, and they cannot be assigned to a state. In 2023-24 they were 177,042 tonnes, 5.8% of the year's metal tonnes, against 0.1% to 1.4% in other years. The 150,000 tonne row above is 85% of that figure, which is why a state-level or "Australian-made" reading of 2023-24 needs care.
- Destination is the declared destination at export, not where the metal ends up.
- 2025-26 is provisional. Later releases can revise it.
How we handle it
We exclude one record: the 92,400 tonne aluminium row of March 2025, because it distorts a headline line (about 16% of that year's aluminium tonnes) and has a plausible explanation. We keep the other 17, because we cannot say they are wrong, and each is small against its metal. We say so on the posts that use the data. We also group lines by the customs product description rather than inventing our own categories, and we label every per-tonne figure as declared export value. If you reproduce our numbers, apply the same exclusion, or you will get a different aluminium line.
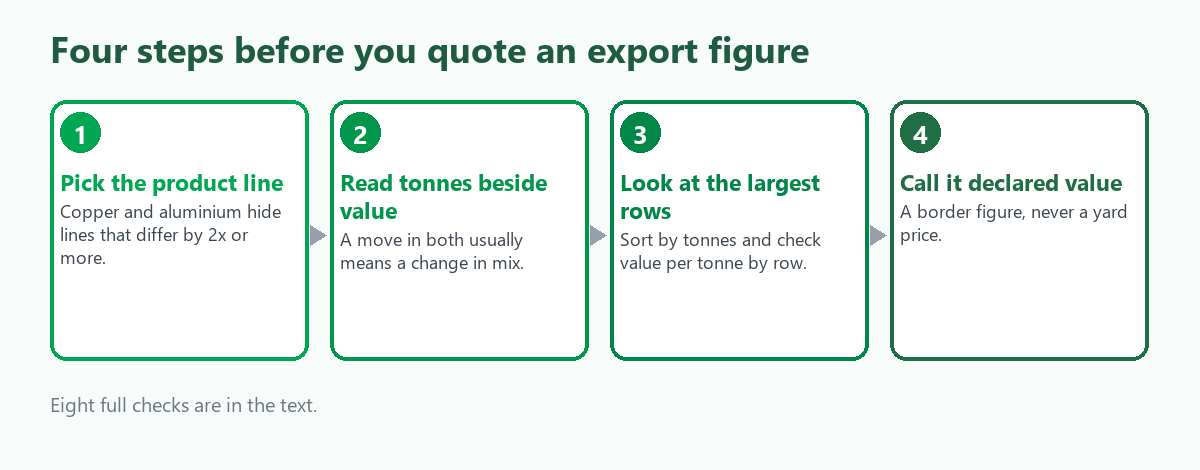
Eight checks before you quote a number
- State the year and whether it is provisional. Years run July to June.
- Name the product line. "Copper" or "aluminium" alone hides lines that differ by a factor of two or more.
- Read tonnes beside value. A move in value per tonne with a move in tonnes usually means a change in mix.
- Check the largest rows. Sort by tonnes and look at the top ten before you trust an average.
- Look at value per tonne by row. Anything far from its line is worth a second look.
- Know whether precious metals are in. They distort whole-metals averages.
- Check the blanks. Port, state and re-exports change what you can compare across years.
- Never call it a price. It is a border declaration. For a price you can check, use the benchmark prices in A$ per kg, the live prices or the Australia scrap calculator.
Where to go next
For the aluminium story see the price chart post; for one state's numbers see Scrap Metal in South Australia: Rules and Data; for ports see Australian Scrap Export Ports: Who Ships What; for destinations see Bangladesh vs Indonesia vs Vietnam: Australian Scrap Buyers; and for what Australia does and does not control on exports see Australia's Waste Export Rules and Scrap Metal. If you are buying from abroad, our global site has Buying Scrap From Australia: A Buyer's Guide and a guide to converting metal prices to your currency. To compare buyers directly, browse the marketplace.
What we could not verify
- A stable public link to the collation file. The government publishes it as a spreadsheet release, and its address can change, so we cite the department and the release date instead.
- The cause of the 18 odd records. We tested one explanation and it covers three.
- The cause of the shift in the beverage-can mix. We see it in the data and do not know why it happened.
- Whether 2025-26 will be revised.
Frequently asked questions
Where does Australian scrap export data come from?
From the Australian Bureau of Statistics export records, collated by DCCEEW in its waste exports data. The release we used is dated September 2026.
Is export value per tonne the price I will be paid?
No. It is the value declared at the border for a mixed shipment. Yard prices depend on grade, quantity, location and the day.
Why does the aluminium line jump in some years?
Part of it is mix, especially beverage cans against other aluminium, and part of one year was a single oversized record that we exclude.
Are the figures reliable?
Mostly, for totals and direction. A small number of rows look wrong, the latest year is provisional, and some fields are blank in early years. Use the checks above.
Sources
- Department of Climate Change, Energy, the Environment and Water, Waste exports data collation, September 2026 (ABS records), ScrapTrade calculations. Metals category, 2017-18 to 2025-26. The 2025-26 figures are provisional.
This is general information, not financial or legal advice. Declared export values are border declarations for mixed shipments, not prices. ScrapTrade operates a scrap marketplace and has a commercial interest in the scrap trade.