

Search for a scrap metal price chart for Australia and you will find a lot of current price lists and very few long histories. This page gives you one. It uses the declared value and tonnes of Australia's metal scrap exports from 2018-19 to 2025-26, the same government trade records behind our other export analysis, and divides one by the other to get a value per tonne for each metal. It is not a yard price list. It is what exporters declared at the border for mixed shipments, and it is the longest consistent public series we have. We show what it says about copper, aluminium and steel, explain what sits behind the jump in aluminium, including one entry in the records that we exclude as a likely recording error, and say plainly what the numbers cannot tell you. ScrapTrade operates a scrap marketplace and has a commercial interest in the scrap trade.
What this chart is, and is not
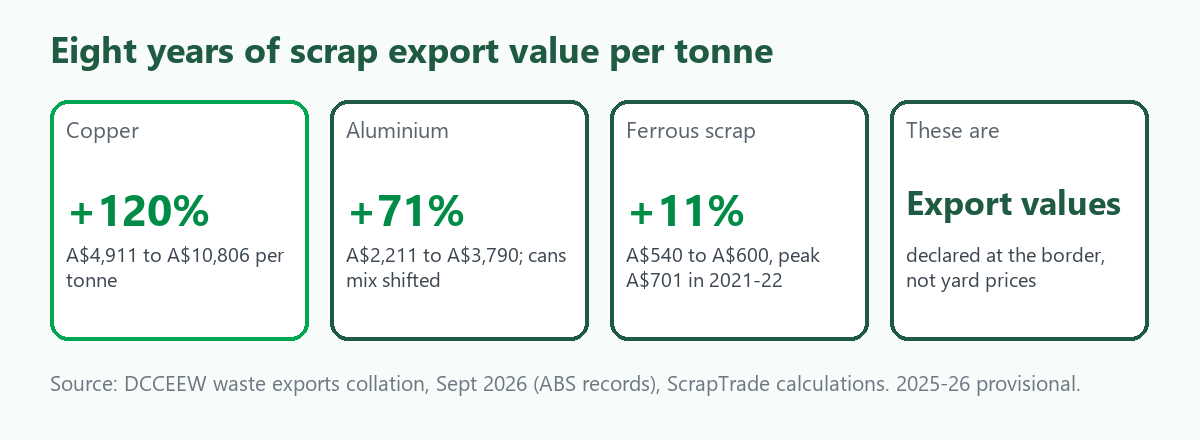
What it is. For each financial year, we take the declared customs value of Australia's scrap exports for a metal and divide by the tonnes shipped. The data is the Department of Climate Change, Energy, the Environment and Water's waste exports collation, built on Australian Bureau of Statistics records, as collated in September 2026. The 2025-26 year is provisional.
What it is not. It is not what a yard pays you. A yard pays a share of what the material is worth downstream, after sorting, handling and its own margin. It is also not a spot price. It is an average over a year, over every grade that was shipped. And it is not the London Metal Exchange benchmark, which is for refined metal. For today's benchmark converted into Australian dollars per kilogram, see Scrap Metal Benchmark Prices in A$ per kg.
The three metals together
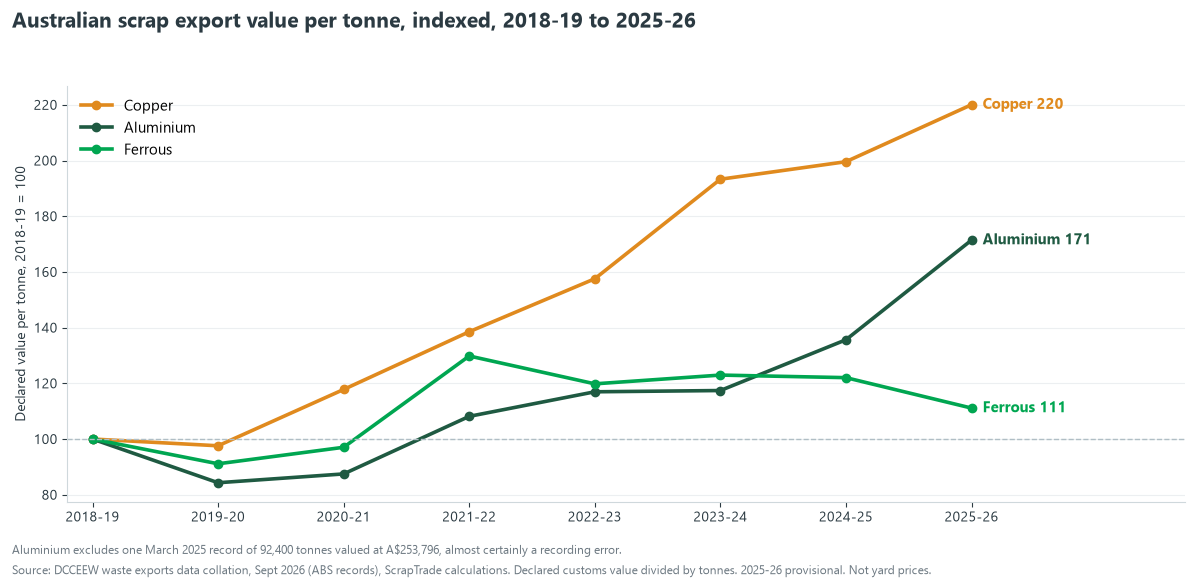
We have indexed each series to 2018-19 so that metals with very different price levels can share one chart. By 2025-26, declared value per tonne was 220 for copper, 171 for aluminium and 111 for ferrous scrap, against a starting level of 100. Copper climbed in six of the seven year-on-year steps. Ferrous scrap peaked in 2021-22 and has drifted down since. Aluminium looks like a late surge, but most of that comes from a change in what is shipped, as the next sections show.
| Financial year | Ferrous (A$/t) | Aluminium (A$/t) | Copper (A$/t) |
|---|---|---|---|
| 2018-19 | 540 | 2,211 | 4,911 |
| 2019-20 | 492 | 1,864 | 4,792 |
| 2020-21 | 524 | 1,934 | 5,785 |
| 2021-22 | 701 | 2,391 | 6,803 |
| 2022-23 | 647 | 2,586 | 7,737 |
| 2023-24 | 664 | 2,596 | 9,492 |
| 2024-25 | 659 | 2,999 (1) | 9,801 |
| 2025-26 (provisional) | 600 | 3,790 | 10,806 |
(1) Aluminium for 2024-25 excludes one March 2025 entry of 92,400 tonnes valued at A$253,796, explained below. As filed, 2024-25 would show 566,723 tonnes at A$2,510. Ferrous and copper are as reported.
Copper: the steady climber
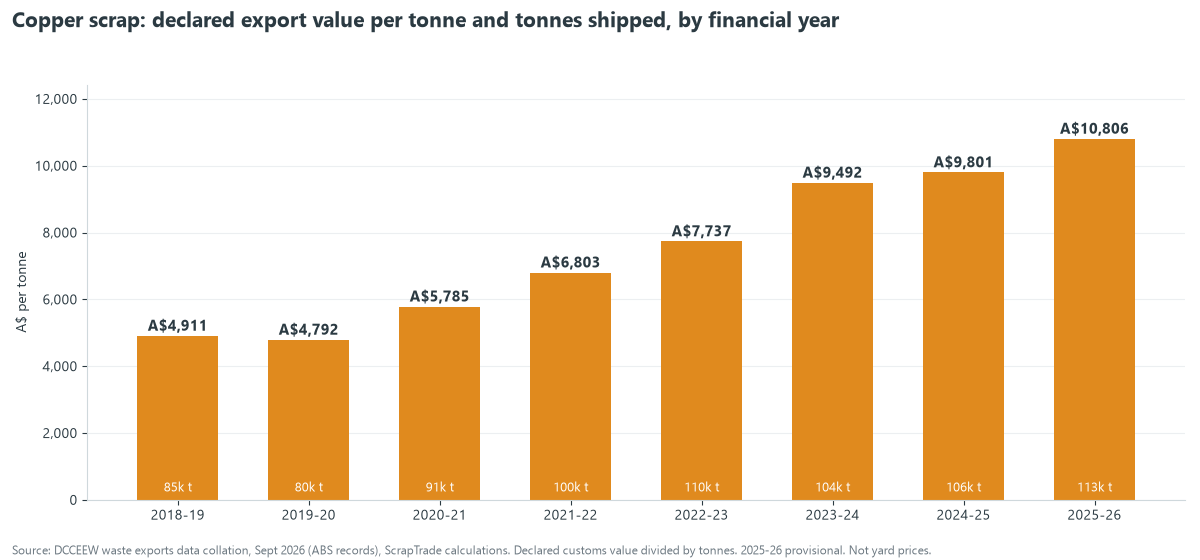
Declared value per tonne for copper scrap rose from A$4,911 in 2018-19 to A$10,806 in 2025-26, an increase of 120%. The only fall was a 2.4% dip in 2019-20. After that came increases of about 21%, 18%, 14%, 23%, 3% and 10%. Tonnes shipped rose too, from about 85,000 to about 113,000 over the period, so the rise in value did not come from shipping less.
Our copper group is HS code 7404, which covers copper and copper alloy scrap, including brass. Because it mixes bare wire, insulated cable, brass and other alloys, the average moves with the mix as well as the market. In quarterly data the 2025-26 figures swing between A$9,375 and A$12,555 per tonne, with the highest value in a quarter with the lowest tonnes. Read years, not quarters. For how yards turn a copper benchmark into a payout, see Copper Price Today in A$: Scrap vs Benchmark, Scrap Yard Copper Prices: How to Check an Offer and Copper Scrap Price Per Kg: Grades Explained.
Aluminium: a jump with an explanation, and one entry to ignore
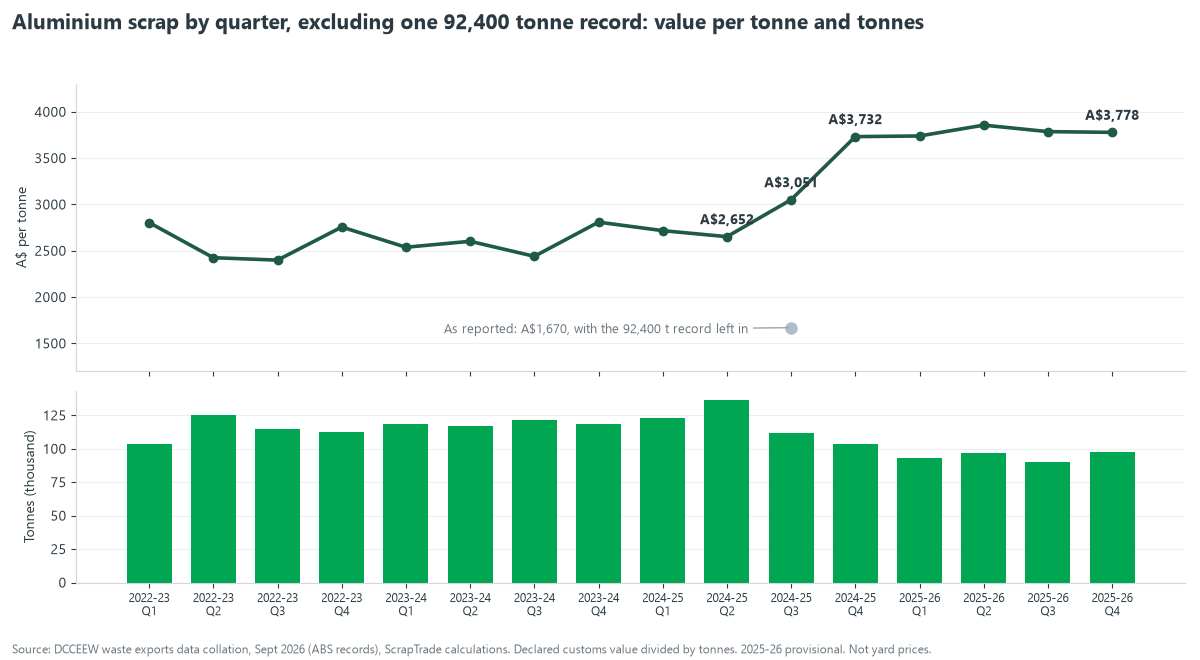
For years aluminium scrap sat between about A$1,860 and A$2,600 per tonne. In 2024-25 the average was A$2,999 and in 2025-26 it was A$3,790, up 26%, while tonnes shipped fell 20%, from 474,323 to 377,501. Two things sit behind those numbers.
First, one entry to ignore. In March 2025 the export records contain a single entry of 92,400 tonnes of aluminium scrap from Townsville to South Korea, declared at A$253,796. That is under A$3 a tonne, against about A$3,000 for the rest of the aluminium shipped that quarter, so the weight is almost certainly a recording error or a different material filed under the aluminium code. We cannot see the shipping document, so we cannot say which. We exclude it, as we do in our other export analysis, including Who Buys Australia's Aluminium and Copper Scrap. Left in, 2024-25 would show 566,723 tonnes at A$2,510, and 2025-26 would look like a 33% fall in tonnes and a 51% rise in value. Those are artefacts of one entry. The grey point in the chart shows the 2024-25 Q3 value as filed, for reference.
Second, a change in the beverage-can part of the trade. Aluminium scrap in the records has two main product lines: used beverage cans and other aluminium scrap. Cans ran at about 49,000 to 64,000 tonnes a quarter, worth about A$1,500 to A$1,900 a tonne, up to 2024-25 Q3. From 2024-25 Q4 they fell to about 40,000 tonnes and then to about 24,000 to 28,000 a quarter, and their value per tonne rose to about A$2,700 and then A$3,000 to A$3,100.
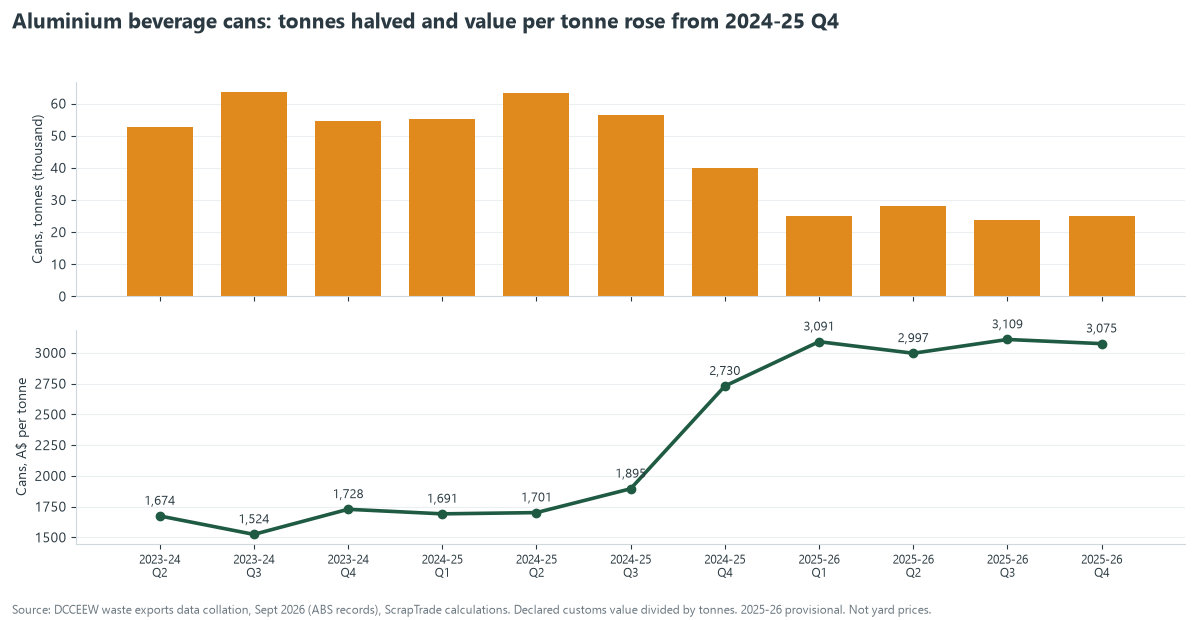
The cheapest can flows dropped out. Cans to Indonesia, declared at about A$530 a tonne, fell from 27,324 tonnes in the first half of 2024-25 to 1,366 in the first half of 2025-26, and cans to Bangladesh, at about A$570 a tonne, fell from 2,712 tonnes to none. Cans to India fell from 48,348 to 21,543 tonnes, and their value rose from about A$1,730 to about A$2,980 a tonne. The other aluminium line stayed between about A$3,400 and A$4,400 a tonne in every quarter shown except the one containing the 92,400 tonne entry. So most of the rise in the average comes from the lowest-value cans leaving the mix, not from every tonne of aluminium becoming dearer. We cannot say why those flows stopped: trade may have changed, material may have been reclassified or declarations may have changed. For aluminium pricing in practice, see Scrap Aluminium Price Per Kg in Australia.
Ferrous scrap: large tonnes, low value, drifting down
Ferrous scrap, which includes steel, cast iron, stainless and tinned scrap, is the bulk of the trade, at 2,547,805 tonnes in 2025-26, up from 2,222,586 in 2018-19. Its declared value is low and moves in a narrow range: A$492 per tonne in 2019-20, a peak of A$701 in 2021-22 and A$600 in 2025-26, 14% below the peak. In the quarterly data the last two quarters of 2025-26 were A$565 and A$574, the lowest of the 16 quarters since 2022-23, and the final quarter was also the biggest by tonnes, at 785,220. A data note: our checks found 17 other entries of more than 500 tonnes declared at under A$50 a tonne, most of them ferrous, including 150,000 tonnes from Brisbane to India in December 2023 declared at A$86,795. We left them in, as in our other analysis, but they pull ferrous values down: excluding all 18 low-value entries would put 2023-24 at A$708 rather than A$664 and the 2021-22 peak at A$727. For steel pricing in practice, see Scrap Steel Prices per Kg and per Tonne.
How to read a chart like this
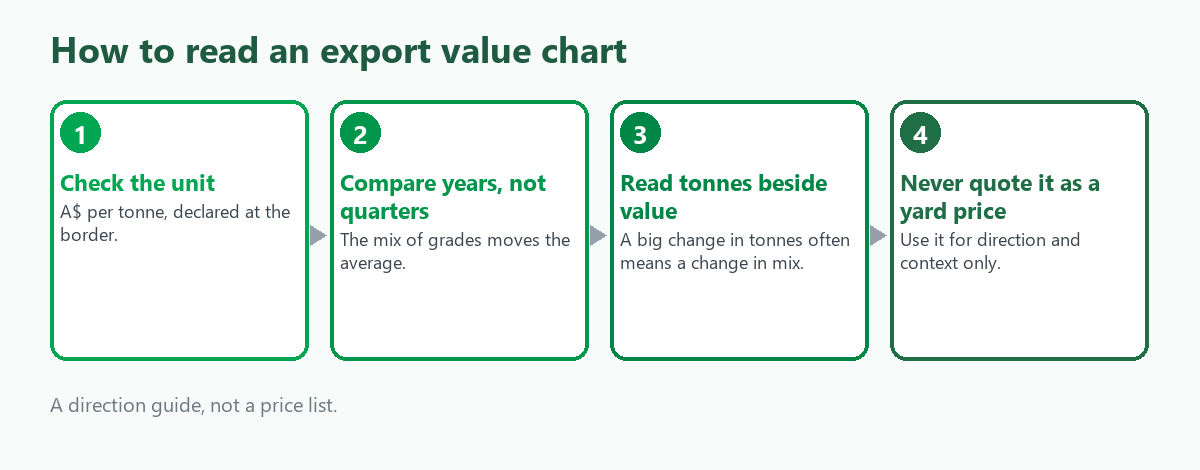
- Check the unit. This is a declared value in Australian dollars per tonne, not per kilogram. Divide by 1,000 for a per-kilogram figure, and remember it is still an export value.
- Compare years, not quarters. The mix of grades shifts from quarter to quarter and moves the average.
- Read tonnes beside value. A large change in tonnes is often a sign the mix changed.
- Do not quote it as a yard price. Use it for direction and context. For a price you can compare an offer against, use the live prices and calculator the Australia scrap calculator and the scrap metal calculator.
What the chart can and cannot help you do
It can help you see which metals have gained or lost value over several years, judge whether a recent move is part of a longer trend, and sanity-check the direction of a quote. It shows, for example, that copper's rise has been long and steady while ferrous scrap's has not.
It cannot help you price a particular lot, forecast next month, or tell you what any grade earns. It also cannot separate a change in the market from a change in the mix.
The benchmark and the export value are different things. On 29 October 2026 the London Metal Exchange official cash settlement for copper was US$14,560 per tonne, which converts to about A$20,643 per tonne at the Reserve Bank of Australia rate that day. The declared export value for copper scrap in 2025-26 averaged A$10,806. The two are for different material, different periods and different points in the supply chain, so do not read the gap as a payout rate. We have not worked out what share of the benchmark any grade earns.
Related export analysis
- Australian Scrap Exports: Seven Years of Change for who buys and how destinations shifted.
- Australia's Scrap Metal Exports: 2025-26 Data for the year in detail.
- Do Scrap Export Volumes Follow Prices? for the link between tonnes and value.
- Australia's Scrap Exports by Month and Australian Scrap Export Ports: Who Ships What.
- For overseas readers, our global site has Buying Scrap From Australia: A Buyer's Guide and How to Convert Metal Prices to Your Currency per kg.
Where ScrapTrade fits
ScrapTrade is a marketplace where sellers list scrap, buyers compare offers and negotiate, and buyers can post what they need. Its price index shows indicative prices by material and currency, updated daily, and it says it does not guarantee their accuracy. Its Trust & Safety page says payment is held in escrow from the moment a deal is confirmed until pickup or delivery is confirmed. Use the market prices page to check a price before you sell, the marketplace to list, and create a free account to start.
Before you quote any export figure from this data, read how to clean it and what to check: Reading Australia's Scrap Export Data Properly.
What we could not verify
- Whether the 92,400 tonne entry is a recording error or a misclassified material. It is almost certainly one of the two. We cannot see the original document.
- Why beverage-can volumes halved and their value per tonne rose from 2024-25 Q4.
- The cause of the other 17 low-value entries. We left them in.
- What share of these values any grade or yard pays.
- Whether the 2025-26 figures will be revised. They are provisional.
- Values before 2018-19. We used eight years that we could compare consistently.
Frequently asked questions
Is this the price a scrap yard will pay me?
No. It is the declared export value of mixed shipments, divided by tonnes. Yards pay a share of what material is worth, and the share varies by grade, quantity, location and buyer.
How much has scrap copper risen in value over eight years?
Declared export value per tonne rose from A$4,911 in 2018-19 to A$10,806 in 2025-26, up 120%.
Why did aluminium rise in 2025-26?
Excluding one recording error, the average rose 26%, from A$2,999 to A$3,790, while tonnes fell 20%. Most of the rise reflects the lowest-value beverage-can flows dropping out of the mix. We cannot confirm why they stopped.
Why do your aluminium numbers differ from the raw data?
We exclude one March 2025 entry of 92,400 tonnes valued at A$253,796, which is almost certainly a recording error. It would otherwise make 2024-25 look 92,400 tonnes larger and cheaper per tonne.
Is there a longer history?
The public series we used starts in 2018-19 for consistency. We did not use earlier years.
Where can I see today's price?
Use the live prices and calculator, and for the world benchmark in Australian dollars see our benchmark page.
Sources
- Department of Climate Change, Energy, the Environment and Water, Waste exports data collation, September 2026 (ABS records), ScrapTrade calculations. Copper is HS 7404, aluminium HS 7602 and ferrous HS 7204. The 2025-26 figures are provisional.
- Westmetall, London Metal Exchange official cash settlement prices, 29 October 2026. Reserve Bank of Australia exchange rate, 29 October 2026, US$0.7053 per Australian dollar.
Figures are ScrapTrade calculations from the sources above and may change when the data is revised. Declared values are border declarations for mixed shipments, not market or yard prices. This is general information, not trading or financial advice. ScrapTrade operates a scrap marketplace and has a commercial interest in the scrap trade.