

The US-Iran war has been running for eight months. It has pushed oil above US$100 a barrel at times, closed or choked a shipping route that carries much of the world's oil, and put missiles into aluminium smelters. In Australia inflation is 4.3% and the Reserve Bank has raised rates four times this year. People who trade scrap ask a fair question: what does all that do to what I get paid, and what happens next? This guide answers it in four parts. It sets out how a war and an inflation spike reach metal prices, what this year's data shows, four scenarios to plan around, and what to watch. It is not a forecast. Nobody can say whether talks succeed or fail, and anyone who gives you a price for next quarter is guessing. Figures are as at 2 to 3 November 2026 and will date quickly. We have a commercial interest in the scrap trade.
Where things stand
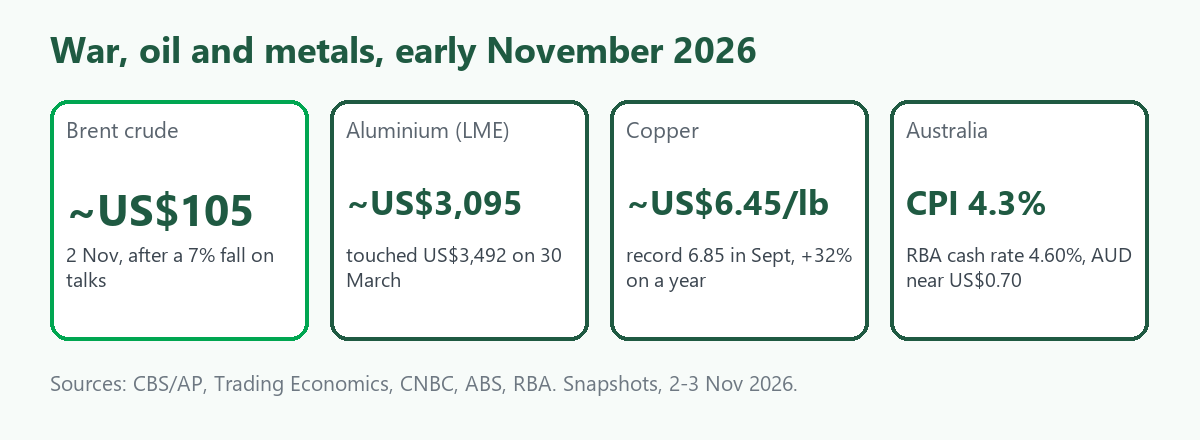
The war began on 28 February 2026 with US and Israeli strikes on Iran. As of 2 November, according to CBS News' live coverage, there has been no formal ceasefire, but the US president says there has been no real fighting for months, and indirect talks mediated by Qatar and Pakistan have run for three days without a clear breakthrough. Iran has effectively blockaded the Strait of Hormuz and the US has a naval blockade on Iranian ports. The UK's maritime monitor counted 30 attacks on commercial ships in October, a record. Iran says it would reopen the strait if sanctions and the blockade were lifted and frozen assets released. Regional officials cited by AP say Israel is pressing for a new air campaign after the US midterm elections on 3 November, while other reports say the US wants talks to continue.
Brent crude fell about 7.4% on 2 November to US$105.03 on hopes of a deal. Since just before the war it has swung between roughly US$70 and US$120 a barrel, according to CBS. Other sources quote different peaks depending on the contract. We treat every number here as a snapshot.
Five ways it reaches a scrap yard
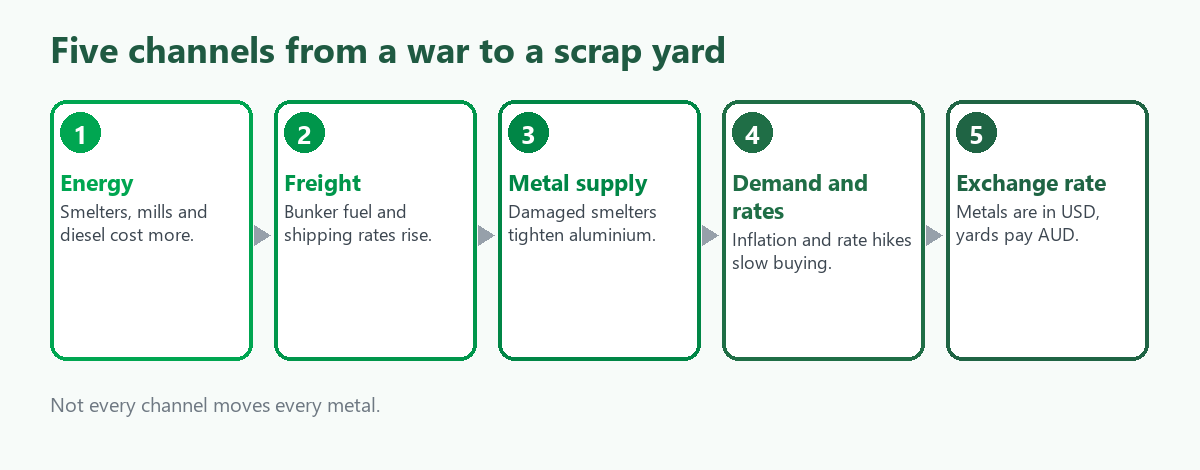
- Energy. Aluminium smelting uses a great deal of electricity, steel mills that melt scrap use electricity and gas, and a yard's trucks and loaders use diesel. When energy gets dearer, producers' costs rise and some cut output, which can mean either higher metal prices or less demand for scrap.
- Freight. Scrap is heavy, so shipping is a large part of its delivered cost. SteelOrbis reported on 1 June that marine bunker fuel at major ports had risen 60% to 75% since late February, and that freight for US East Coast scrap to Turkey had risen from about US$30 to US$46 to 48 a tonne. When a buyer pays more to ship, the price an exporter can get at the port tends to fall, other things equal. SteelOrbis's author expected elevated freight to last six to twelve months, but that is opinion.
- Supply of the metal itself. The Gulf produces about 9% of the world's aluminium. On 28 March Iranian drones and missiles hit two of its largest producers, Emirates Global Aluminium and Aluminium Bahrain, and EGA said its Al Taweelah smelter was significantly damaged. LME aluminium touched US$3,492 a tonne on 30 March, the highest since April 2022. Macquarie's pre-attack base case was a 20% cut to running capacity, roughly 800,000 to 900,000 tonnes of lost output in 2026, enough to put the market into deficit. Less new metal makes scrap more valuable as a substitute.
- Demand, inflation and interest rates. War-driven energy costs lift inflation. Central banks respond with higher rates, which slow construction, manufacturing and car sales, the biggest buyers of metal. Trading Economics' reading of the copper market on 2 November lists worries about rate hikes and slower growth as a drag. Trade reports we saw, including from SteelOrbis and S&P Global, described weak downstream steel demand capping scrap buying even when energy and freight were rising.
- The exchange rate. Metals are priced in US dollars, and yards pay in Australian dollars. The Australian dollar was about US$0.70 on 3 November, up about 7.8% on a year. At a given US dollar price, that is about 7% fewer Australian dollars. Rising rates in Australia can lift the currency, so the same event can hit yard prices through two routes.
A sixth channel is policy. The US has a 50% tariff on imported aluminium products, copper traders have been moving metal to US warehouses on tariff fears, and the trade press CRU has reported that the EU may lead on restrictions on scrap exports. We have not verified any current restriction.
What this year's numbers show
The first lesson is that metals did not move together.
- Aluminium rose, then gave most of it back. After touching US$3,492 on 30 March it fell to about US$3,000 in October, the lowest since February, as Gulf smelters restarted faster than expected and Chinese output and exports stayed high. EGA said on its recovery that a quarter of Al Taweelah was running and that it expected full recovery by the first quarter of 2027. On 2 November aluminium was about US$3,095, up about 6% on a year. A risk premium rose quickly on attack news and unwound as supply came back. Physical recovery is slower than the headlines: the premium fell while the smelter was still only partly running.
- Copper hit a record for reasons that are mostly not the war. It reached about US$6.85 a pound in September (our conversion: about US$15,100 a tonne) and was about US$6.45 on 2 November, up about 32% on a year. Trading Economics ties it to power-grid and data-centre demand, a fall in Chile's output to the lowest in at least two decades, and tariff positioning. High oil and rate worries have weighed on it.
- Steel scrap rose modestly and then faded. SteelOrbis reported US heavy melting scrap to Turkey at US$368.50 a tonne CFR on 26 February and a high of US$411.50, up about 12%, with freight and energy cited. It fell back as weak demand limited buyers.
The second lesson is in Australia's own export records.
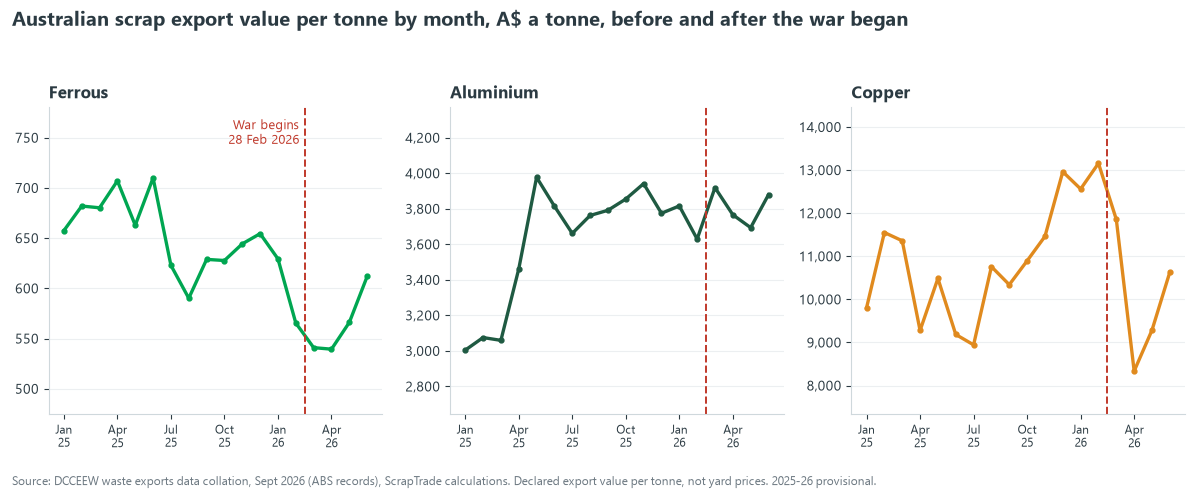
Ferrous scrap's declared value per tonne fell, not rose, after the war began: from about A$655 in December 2025 to A$565 in February, then A$541 in March and A$539 in April, before recovering to A$612 in June. But the slide began before 28 February, so the war did not start it. Oil was up and ferrous was down. That fits freight costs and weak demand outweighing energy costs for an exporter, but the data cannot show the cause. Australian export values are recorded before ocean freight, as we understand ABS practice, which would put a freight rise outside the number and show up instead as a lower price at the port. Aluminium stayed between A$3,630 and A$3,919 a tonne in every month from December. Copper swung widely, from A$13,157 in February to A$8,336 in April, largely because the mix of alloys changes. These are declared border values, not yard prices. See Reading Australia's Scrap Export Data Properly.
How much of Australian scrap goes near the war?
Little. The six Gulf Cooperation Council countries took 69,865 tonnes of Australian metal scrap in 2025-26, 2.3% of the total, and 96% of that went to Saudi Arabia (66,846 tonnes). Almost all of it left before the war: in the March and June quarters the Gulf took 0.3% and then none. Turkey took 27,026 tonnes (0.9%). The main buyers are in South and Southeast Asia, covered in Australia Scrap Export Tracker: June Qtr 2026. So the war reaches Australian yards through the channels above (energy, freight, global prices, rates and the currency), not through lost customers in the region.
Four scenarios
These are reasoning from how markets behaved this year, not forecasts. We give no probabilities.
| Scenario | Oil and freight | Aluminium | Copper | Ferrous scrap | For a yard |
|---|---|---|---|---|---|
| Deal, Hormuz reopens | Oil falls first; freight eases more slowly, since bunker prices and shipping schedules take months to reset | Risk premium falls further; recovery of Gulf smelters, due by early 2027, adds supply | Mixed: lower energy costs and inflation help, but its main drivers are elsewhere | Costs ease; the price depends on mill demand, which is weak | Freight and fuel costs fall with a lag; AUD may firm with lower inflation |
| Stalemate (roughly the recent months) | Oil range-bound but jumpy; freight stays high | Range-bound near current levels, with spikes on attacks | Follows tech, grid demand and tariffs | Soft: high costs, weak demand | Quote short, refresh often |
| Re-escalation | Oil spikes; freight and insurance up; the strait's status matters most | Spikes on any new hit to Gulf smelters, as on 30 March | Often weaker on growth fears, as oil rises | Costs rise; demand may weaken | Volatile quotes; delivered prices lag; inflation and rate risk rise |
| No news | Gradual drift | Follows China output and exports, USD and stocks | Follows AI, grid demand and Chile | Follows steel demand | Rates and inflation matter most |
Two asymmetries are worth keeping in mind. A fear premium can unwind in days, but freight, shipping schedules and a damaged smelter take months. And a re-escalation would not push every metal the same way: this year aluminium reacted to a physical hit on smelters, and copper did not.
What if tomorrow is quiet?
Then the drivers that were already there still move prices. In Australia, inflation was 4.3% in the 12 months to September, with automotive fuel up 23.6%, and trimmed mean inflation was 3.6%, according to the ABS. The Reserve Bank's cash rate has been 4.60% since 30 September after hikes in February, March, May and September, and markets were expecting another 0.25 point rise on 3 November. Higher rates cool construction and manufacturing, raise the cost of holding stock, and tend to firm the dollar. China's aluminium exports were up 25.9% on a year in September, according to Trading Economics. Copper depends on data-centre and grid demand. Seasonal patterns still apply, as in Australia's Scrap Exports by Month. For whether volumes follow prices at all, see Do Scrap Export Volumes Follow Prices?.
What inflation does to a scrap business
Inflation hits a yard's costs before it touches its revenue: fuel, wages, insurance, repairs and the interest on stock and equipment. Metal prices do not follow the consumer price index. This year copper, aluminium and steel scrap moved for different reasons and by different amounts, and ferrous scrap's declared value fell while consumer prices rose. A yard whose margin is a fixed spread between buying and selling prices can be squeezed when costs rise faster than the spread, and fixed buy prices quoted for days at a time carry the most risk when markets swing.
A practical roadmap
None of this is financial advice. It is how a sensible trader would keep decisions tied to evidence.
- Separate a headline from a price. A spike in LME aluminium on attack news is not the price you will be paid. Use the benchmark prices in A$ per kg, the live prices and the calculator.
- Convert to Australian dollars. A fall in US dollar prices can be bigger or smaller in Australian dollars. See Convert Metal Prices to Your Currency per Kg.
- Shorten how long a quote lasts in volatile weeks, and write the validity period on it.
- If you export, price freight explicitly. Ask whether a deal is CFR or FOB, and who carries a rise in shipping costs. See Incoterms in Scrap Deals.
- Do not hold stock on a hunch about the war. Holding costs money, and this year's spikes were reversed within weeks to months.
- Compare more than one buyer before you sell a large lot. Browse the marketplace or create a free account.
What to watch
| Indicator | Why | Where |
|---|---|---|
| Brent crude | Sets energy and freight direction | Any live market quote |
| Attacks on shipping and Hormuz transits | Decides freight and insurance | UKMTO, major news |
| LME aluminium and copper | Global metal direction | LME, Trading Economics |
| AUD/USD | Converts world prices to yard prices | RBA, any currency quote |
| RBA decisions and ABS CPI | Costs, demand and the dollar | rba.gov.au, abs.gov.au |
| Chinese metal exports | Supply that caps rallies | Customs data, trade press |
For Indian rupee conversions of metal prices, see: Scrap Metal Prices in India: Kg, Quintal, Tonne.
For an opinion on planning for a downturn, see: Why Recyclers Should Plan for a Downturn Now.
What we could not verify
- What happens next. Talks and escalation are unpredictable, and we have no forecast of price levels.
- Current scrap prices. We publish none, and the export values are not prices.
- Why ferrous declared value fell. We offer freight and weak demand as consistent with the data, not as the cause.
- Exact peaks. Brent peaks differ by contract and source.
- Trade press and analyst claims. Figures from SteelOrbis, Macquarie, CNBC and Trading Economics are theirs, and some are opinion. Some of our sources describe events we could not check independently.
- Whether freight stays high. The six to twelve month view is one editor's opinion.
Frequently asked questions
Does the Iran war raise scrap metal prices?
Not simply. In 2026 it raised aluminium for a time, through physical damage to smelters, and raised freight and energy costs, but ferrous scrap's declared export value in Australia fell after it began, and copper's record rise had other causes.
What happens to scrap prices if there is a peace deal?
Our reasoning is that the risk premium in aluminium and oil would fall first, while freight and smelter recovery would take months. We cannot say what any price will be.
How does inflation affect scrap metal?
It raises a yard's costs, and through interest rates it slows construction and manufacturing demand, but metal prices do not track consumer prices.
Should I sell my scrap now or wait?
We cannot tell you. Compare a current quote with the benchmark, and do not hold stock on a hunch.
Sources
- CBS News, live updates on the US-Iran war and negotiations, 2 November 2026 (citing AP, AFP, Axios, IRNA and Al Jazeera).
- CNBC, Iran attacks Gulf aluminium producers, 30 March 2026.
- Trading Economics, aluminium, copper and Australian dollar pages, 2 to 3 November 2026. Contract-for-difference prices, for reference only.
- SteelOrbis, The future of the Iran war's squeeze on steel freight costs and bunker fuel, 1 June 2026 (opinion piece, reported facts and forecasts mixed).
- Australian Bureau of Statistics, Consumer Price Index, Australia, released 28 October 2026.
- Reserve Bank of Australia, cash rate target, rba.gov.au.
- Department of Climate Change, Energy, the Environment and Water, Waste exports data collation, September 2026 (ABS records), ScrapTrade calculations. The 2025-26 figures are provisional.
This is general information, not financial or investment advice. Prices and events change quickly. ScrapTrade operates a scrap marketplace and has a commercial interest in the scrap trade.