

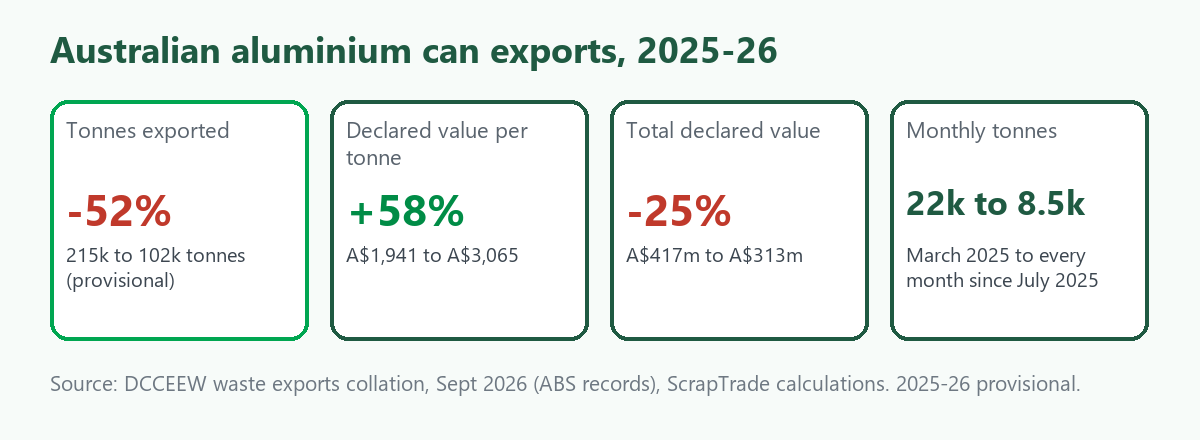
Australia exported 214,964 tonnes of aluminium beverage cans in 2024-25 and 102,150 tonnes in 2025-26 (provisional). That is a fall of 52% in a trade that had held between 215,000 and 222,000 tonnes a year for four years. At the same time the declared value per tonne rose 58%, so the declared value of the whole trade fell only 25%. This post sets out what the government's export records show about that change: when it happened, where the cans went, and how much of the price move is a change in the mix of buyers. It also lists what we cannot explain, which is a lot. It follows our price chart post, where cans first showed up as the driver of the aluminium line. We have a commercial interest in the scrap trade.
When it happened
The change was sudden, not a slide. Monthly can exports ran at about 14,000 to 25,000 tonnes from July 2023 to March 2025 and were still 22,206 tonnes in March 2025. Then:
- April 2025: 18,556 tonnes
- May 2025: 12,192 tonnes
- June 2025: 9,218 tonnes
- July 2025 onward: between 6,561 and 10,970 tonnes every month, and 8,100 to 8,800 in ten of the twelve months
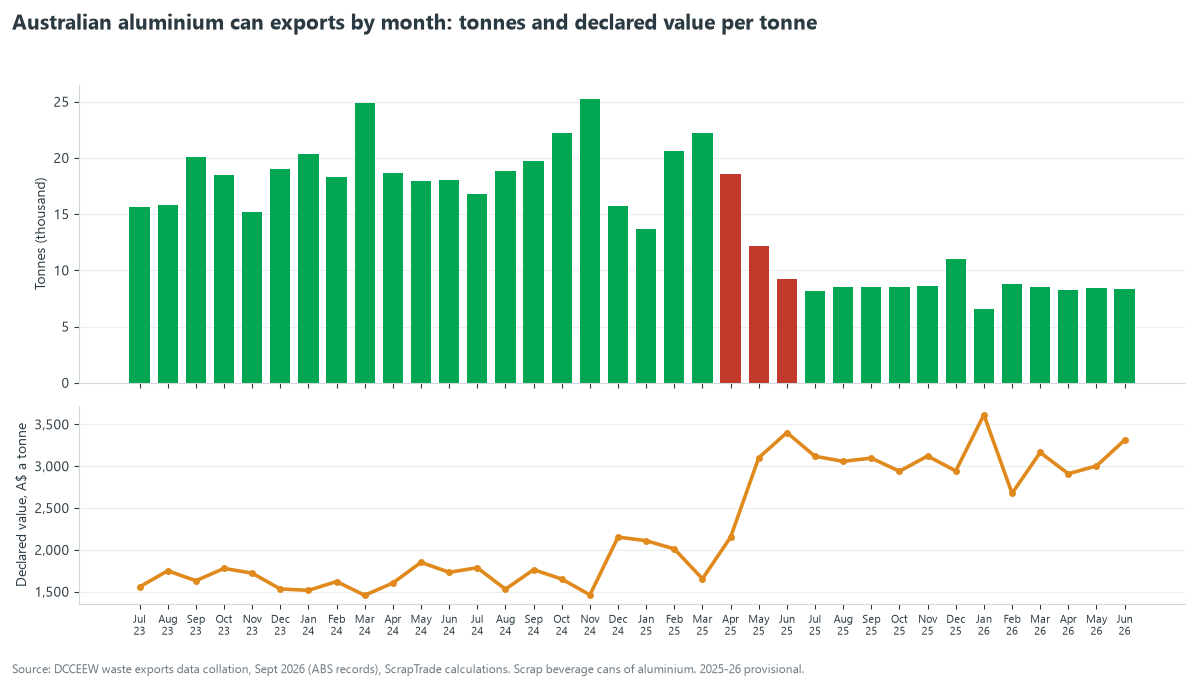
Two features stand out. First, the tonnage fell for three months and then stopped falling: from July 2025 it is unusually flat, near 8,500 tonnes a month. Second, the value per tonne moved in the same months, from about A$1,650 in March 2025 to A$3,101 in May and A$3,402 in June. After that it stays between A$2,700 and A$3,600. A flat monthly volume after a sharp fall is not what a drifting market looks like, and we cannot say why it happened. The pattern is consistent with a change in what is being declared under this code, in who is buying it, or both.
The fall was national. Between 2024-25 and 2025-26, can tonnes fell by about half in Victoria (74,511 to 36,711), Queensland (54,802 to 27,233) and New South Wales (45,241 to 25,020), and by three quarters in Western Australia (33,990 to 8,588). It was not one port or one state.
Where the cans went
The table shows declared destinations by financial year.
| Destination (tonnes) | 2021-22 | 2022-23 | 2023-24 | 2024-25 | 2025-26 |
|---|---|---|---|---|---|
| India | 18,836 | 38,261 | 64,969 | 92,198 | 43,177 |
| South Korea | 42,744 | 39,006 | 38,898 | 49,884 | 37,648 |
| Indonesia | 97,036 | 69,926 | 54,482 | 37,285 | 1,821 |
| Malaysia | 10,064 | 28,679 | 29,204 | 8,237 | 4,082 |
| Thailand | 16,549 | 16,825 | 25,637 | 15,025 | 7,864 |
| Bangladesh | 120 | 780 | 4,536 | 5,760 | 0 |
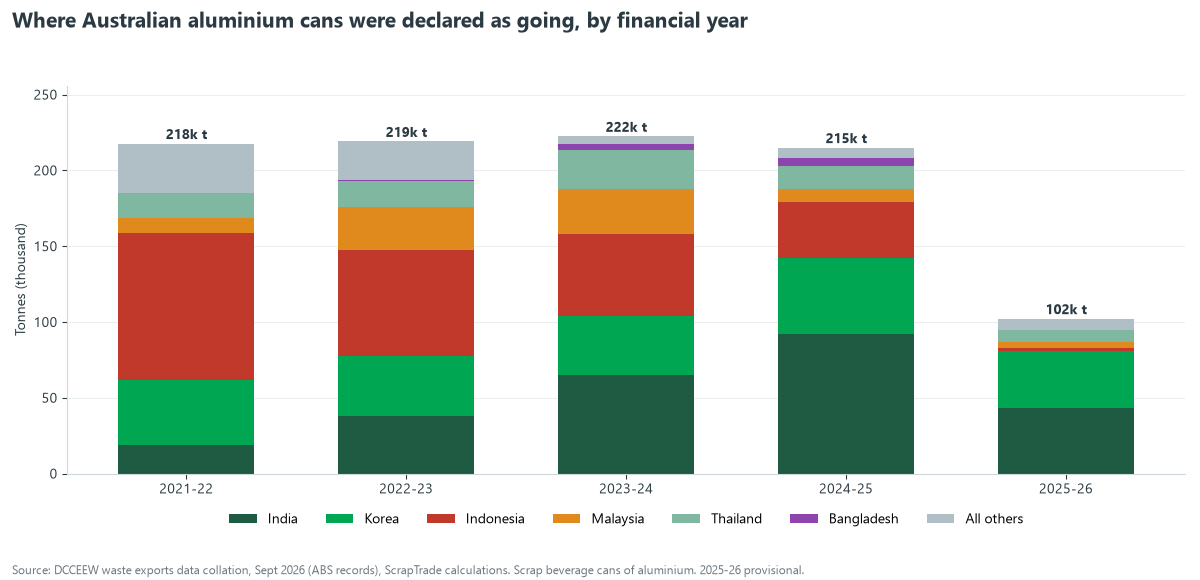
Indonesia was the largest destination in 2021-22, with 97,036 tonnes, and received almost nothing in 2025-26 (1,821 tonnes). The decline there started years before the 2025 step: its tonnes fell every year. India grew every year until 2024-25, then halved. South Korea held steady at 38,000 to 50,000 tonnes in every year.
The change between the last two years, by destination, is below. Of the 112,815 tonnes lost, India accounts for 49,021 (43%) and Indonesia for 35,464 (31%). The three lowest-value destinations by declared value per tonne in 2024-25 (Indonesia, Malaysia and Bangladesh, all between A$520 and A$1,450 a tonne) account for 45,379 tonnes, or 40% of the fall.
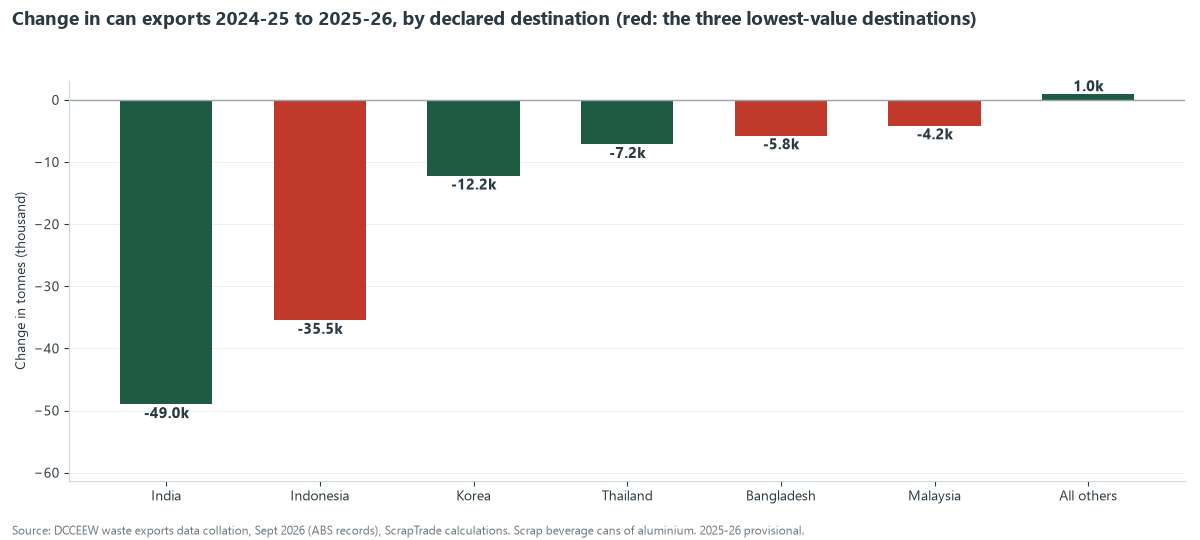
So the common summary, that the cheapest flows dropped out, is true but covers only 40% of the fall. India and Korea also fell, by a combined 61,000 tonnes.
How much of the price rise is mix
Declared value per tonne for cans rose from A$1,941 in 2024-25 to A$3,065 in 2025-26. To separate mix from price, we revalued the 2025-26 tonnes at each destination's 2024-25 value per tonne. That gives A$2,400, so about 41% of the rise (A$459 of A$1,124) comes from the change in where the cans went, and about 59% (A$665) from higher declared values to the same destinations. India rose from A$1,805 to A$2,944 a tonne, South Korea from A$2,975 to A$3,435, and Thailand stayed near A$3,400.
Two limits apply. The method sees destinations only, so a change in what is inside the code, such as baled cans against shredded or more processed material, would show up as a "price" change. And world aluminium prices were also rising. One secondary source reports an average of about US$2,632 a tonne for 2025, up 8.8% on 2024, and prices reaching about US$3,750 in early June 2026. We did not convert or line these up to the Australian financial year, so we treat them as context only. India's increase of 63% in a single year is larger than those world price moves, though the periods are not aligned.
What might explain it, and what does not
We found no report that explains the Australian change directly. Here is what we found, and how far it gets.
- Southeast Asian policy. A market analysis from SMM (August 2025) describes a criminal probe into scrap export licensing in Malaysia in July 2025, with longer customs clearance times, and a border closure affecting Thailand in the same month. These came after the April to June 2025 step, so they cannot be what started it. Another analysis says Indonesia tightened classification and licensing rules for recyclable metal waste in 2025, and that Malaysia applies a 10% export duty and purity limits to aluminium scrap. We could not confirm either the Indonesian or the Malaysian claim from a primary source, and none of these sources discusses Australian cans.
- Recycling system changes. Cans reach exporters through container deposit schemes and kerbside collection. We did not look for a change in how or where cans are processed in Australia and cannot say whether there was one.
- Domestic use. Cans could be staying in Australia or going into further processing before export. The export data cannot show that, and we found no source on it.
- A change in reporting. A reclassification of what is declared under the can code would produce a step like this one. We have no evidence for it and none against.
If you know the cause, the useful evidence would be the exporters' own shipping and customs data, or a recycler's explanation of where its baled cans went in 2025. We would add it.
What this means if you buy or sell cans
- Do not read A$3,065 a tonne as a price. It is a customs declaration for mixed shipments. For a price you can check, see Scrap Metal Benchmark Prices in A$ per kg, the live prices and the aluminium calculator.
- Do not assume a Southeast Asian buyer will take cans on old terms. Indonesia, Malaysia and Bangladesh took 51,282 tonnes in 2024-25 and 5,902 in 2025-26. Ask any buyer what they have taken lately, not what they took in 2023.
- Expect Indian and Korean buyers to be where the volume is now. They took 80,825 of the 102,150 tonnes in 2025-26, 79%. For how these markets compare, see Bangladesh vs Indonesia vs Vietnam: Australian Scrap Buyers.
- If you buy from Australia, the supply you can count on is smaller than the last four years. Read Buying Scrap From Australia: A Buyer's Guide.
- If you are selling cans, create a free account to list a lot, or browse the marketplace to see what buyers are asking for.
To check any of these numbers yourself, start with Reading Australia's Scrap Export Data Properly.
For Queensland's new metal theft laws and export data, see: Scrap Metal in Queensland: Rules and Data.
For which scrap Western Australia's dealer law covers, and WA export data, see: Scrap Metal in Western Australia: Rules, Data.
For the latest quarter of export data, see: Australia Scrap Export Tracker: June Qtr 2026.
For how the Iran war, oil and inflation reach metal prices, see: War, Oil and Inflation: What Moves Scrap Prices.
For overseas buyers of copper and aluminium scrap, see: Buying Copper and Aluminium Scrap in Australia.
What we could not verify
- Why can exports fell. We give four candidate explanations and confirm none.
- Why the monthly volume has been so flat since July 2025.
- Whether the declared goods changed. The dataset gives one code for cans and no detail on form or grade.
- The 2025 and 2026 aluminium price figures, which come from secondary sources and are not aligned to the financial year.
- Whether 2025-26 will be revised. It is provisional.
Frequently asked questions
How many aluminium cans does Australia export?
In 2025-26, 102,150 tonnes (provisional), down from 214,964 tonnes in 2024-25. Exports were between 215,000 and 222,000 tonnes in each of the four years before that.
Where do Australian aluminium cans go?
In 2025-26, mainly India (43,177 tonnes, 42%) and South Korea (37,648 tonnes, 37%), then Thailand (7,864 tonnes), China (4,624 tonnes) and Malaysia (4,082 tonnes).
Did can prices double?
Declared value per tonne rose 58% in 2025-26, from A$1,941 to A$3,065. About 41% of that rise comes from a change in destinations and the rest from higher declared values at the same destinations. It is not a yard price.
Why did exports to Indonesia stop?
We do not know. They fell every year from 97,036 tonnes in 2021-22 to 1,821 tonnes in 2025-26. We found no confirmed explanation.
Sources
- Department of Climate Change, Energy, the Environment and Water, Waste exports data collation, September 2026 (ABS records), ScrapTrade calculations. Product description "Scrap beverage cans of aluminium", all states, 2017-18 to 2025-26. The 2025-26 figures are provisional.
- SMM, "Four Converging Factors in 2025 Undermine Southeast Asia's Comparative Advantage" (14 August 2025) and "ASEAN's Aluminum Scrap Trade Amid a Shifting Global Economy", news.metal.com. Market commentary, used for context on Southeast Asian policy only.
- MetalCharts, aluminium price history, citing World Bank and LME data. Secondary source, preliminary 2025 figures, used for context only.
This is general information, not financial advice. Declared export values are border declarations for mixed shipments, not prices. ScrapTrade operates a scrap marketplace and has a commercial interest in the scrap trade.